Persist, transform & provide Data
Role: Data Architect, Data Steward
Goal: You want to build pipelines, transform and persist data, and make it available for consumption through an API.
Required Permissions: create Dataset, release Dataset
What you will achieve
After completing this guide, you will have:
- Created a Dataset
- Defined and validated a Pipeline
- Created a Mapping
- Defined an API
- Managed optionally access permissions
- Set the Dataset status to mark it as Ready
Before you start
- Verify that you can create Datasets. If this option is unavailable, contact your Tenant Admin to request access.
Understand your data flow
Before building a pipeline, make sure you understand how your data flows through the system. In CIVITAS/CORE, data is processed and stored through Pipelines before it can be made available through an API.
This means:
- data is loaded from a Data source
- transformed step by step
- stored in a storage
- provided through an API
In this guide, we demonstrate how to persist and transform data using this example use case. It shows how master data and measurement data are processed in pipelines and stored as Observations in a SensorThings API backend.
→ You will find additional context from the Smart Meter energy use case in the highlighted boxes throughout this guide.
Requirements
Two types of data are processed:
- Master data → used to create SensorThings entities such as Things and Datastreams
- Measurement data → continuous smart meter values received via MQTT
Pipelines are used to:
- load data from Data sources
- transform and map the data
- provide the data for further use
Make sure you have:
- available Data sources for master data and measurement data
→ Before measurement data can be stored, the required SensorThings entities must exist. In this guide, you will build pipelines to process both data flows.
Step-by-step guide
Step 1: Create a Dataset
- Go to Datasets
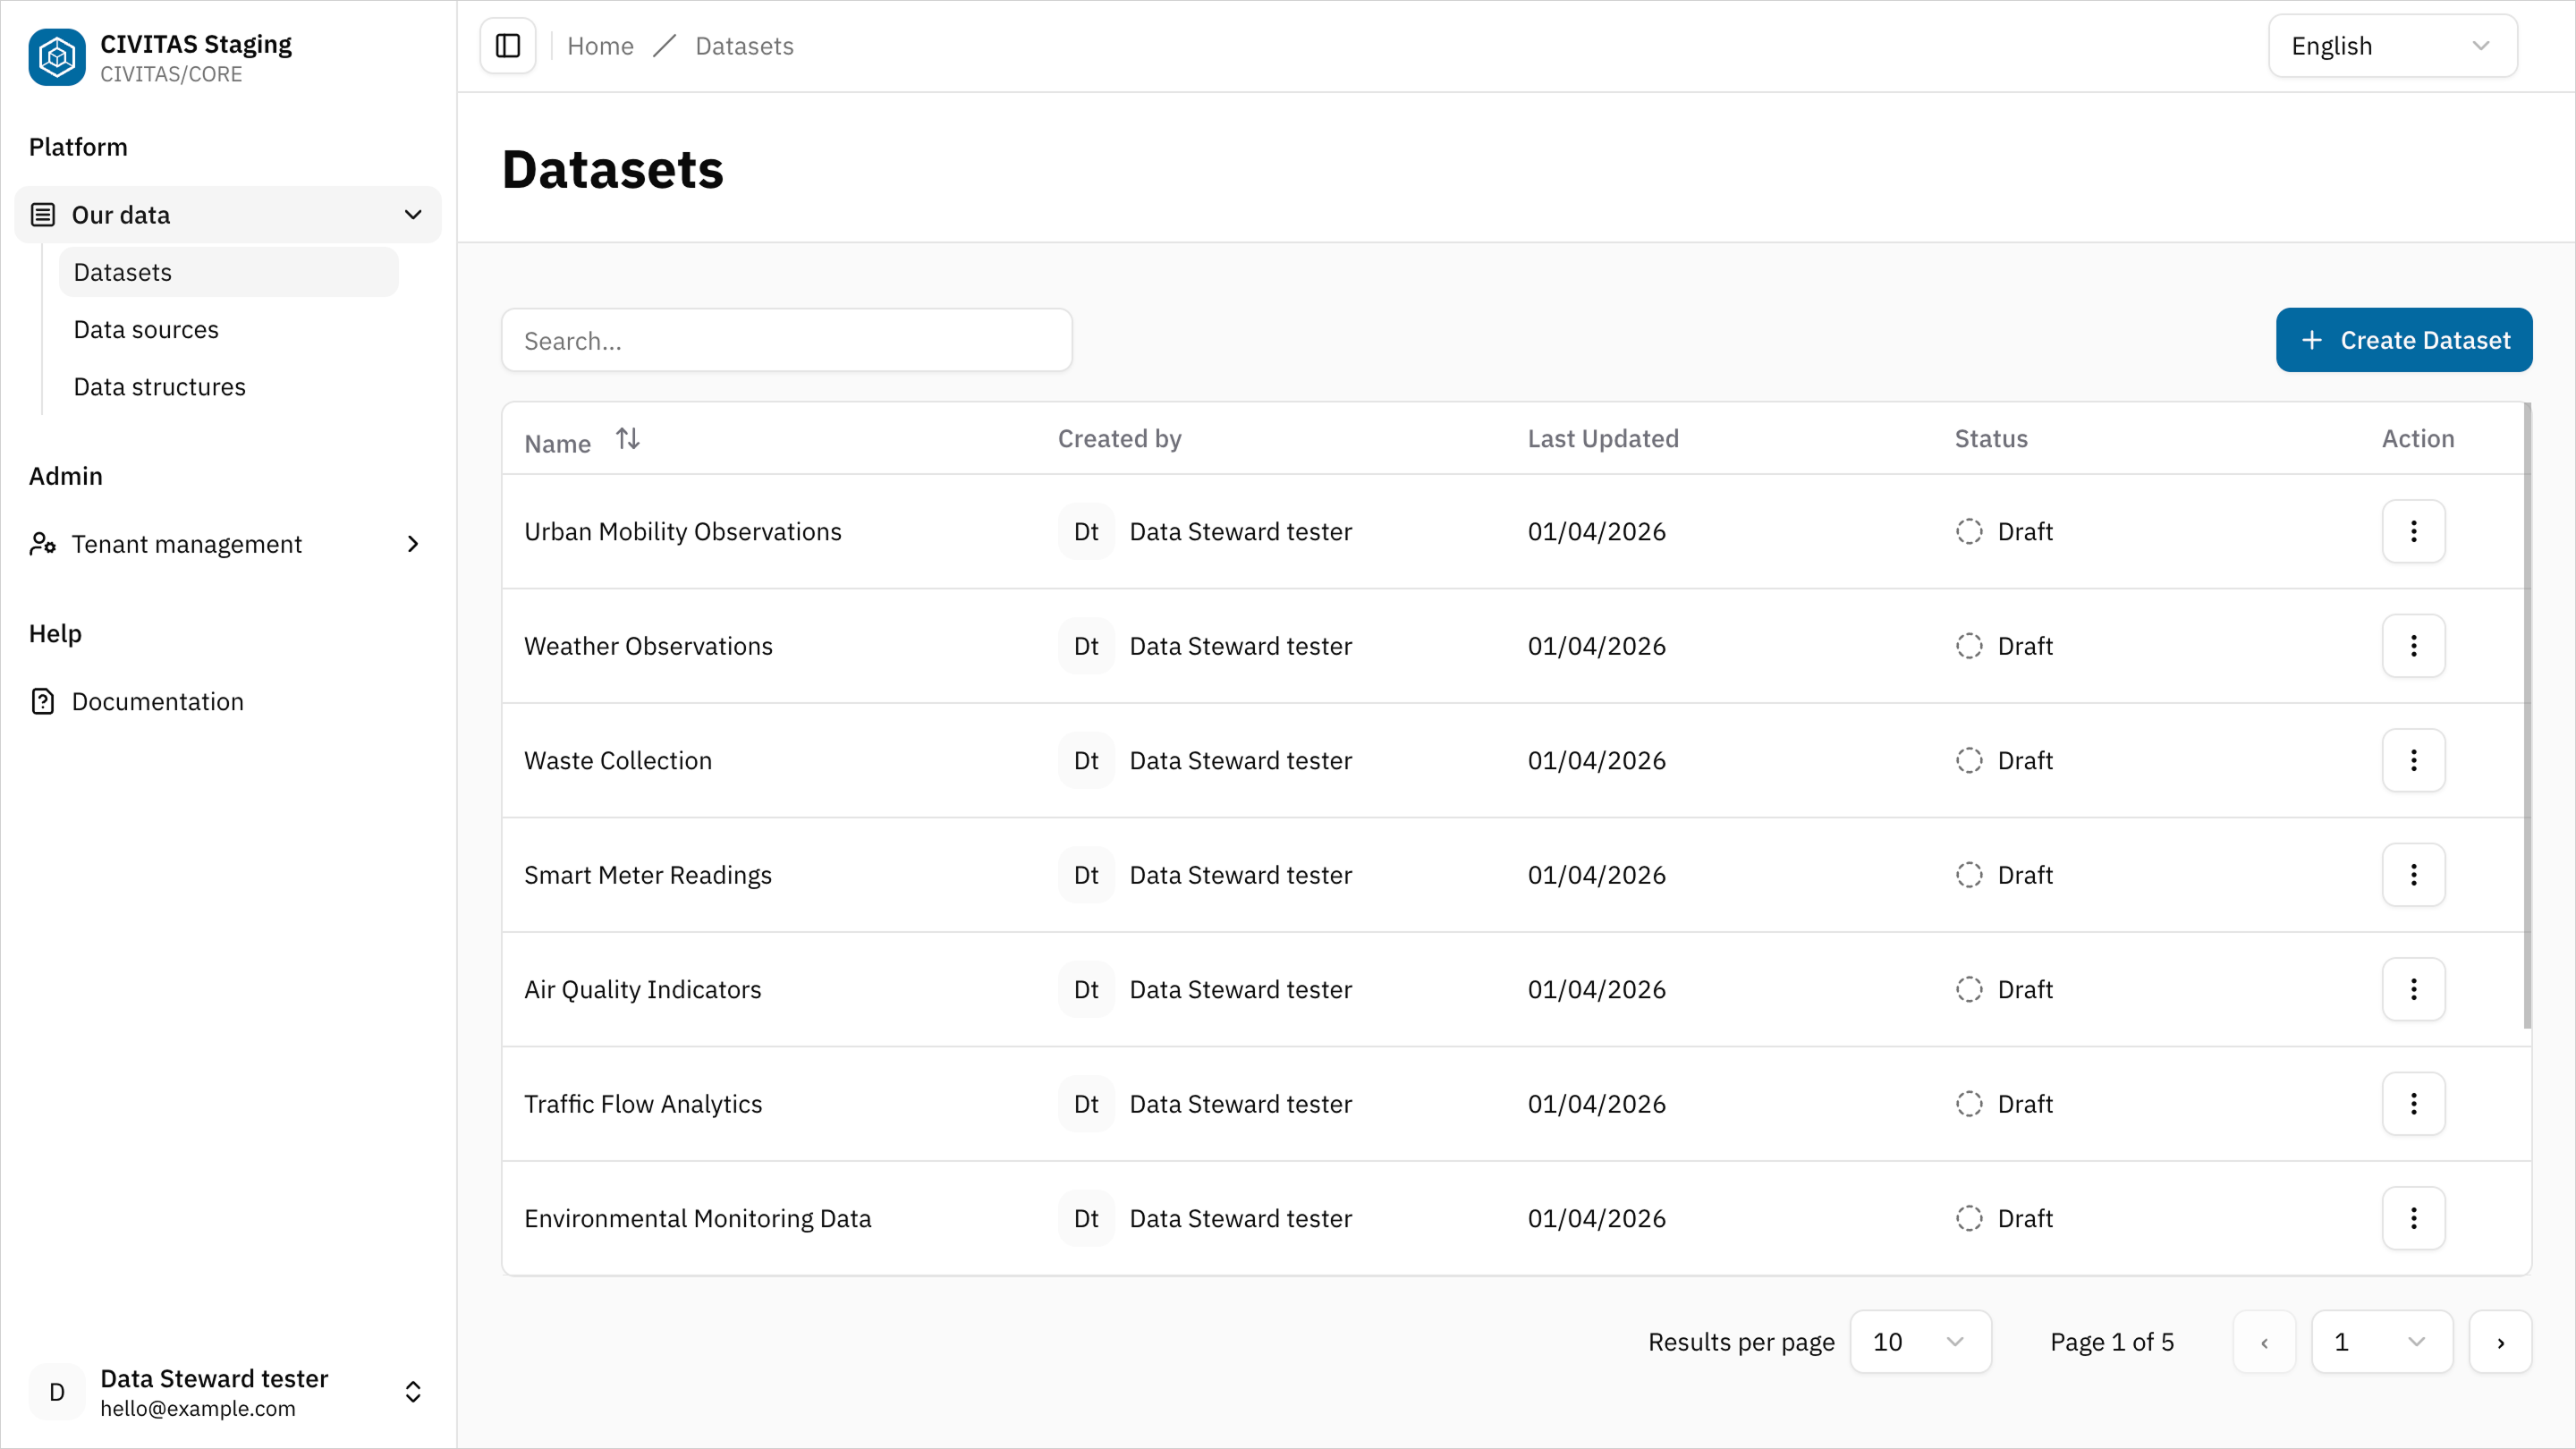
- Click Create Dataset
- Enter Name and hit Create and continue
- Add Base Information and hit Save
Create a Dataset to combine and process smart meter data from different Data sources.
Example name:
- Smart Meter energy usage
Step 2: Define a pipeline
→ A pipeline is an automated sequence of steps used to ingest, transform, or store data within the Platform.
- Click Add pipeline in the section Data flow
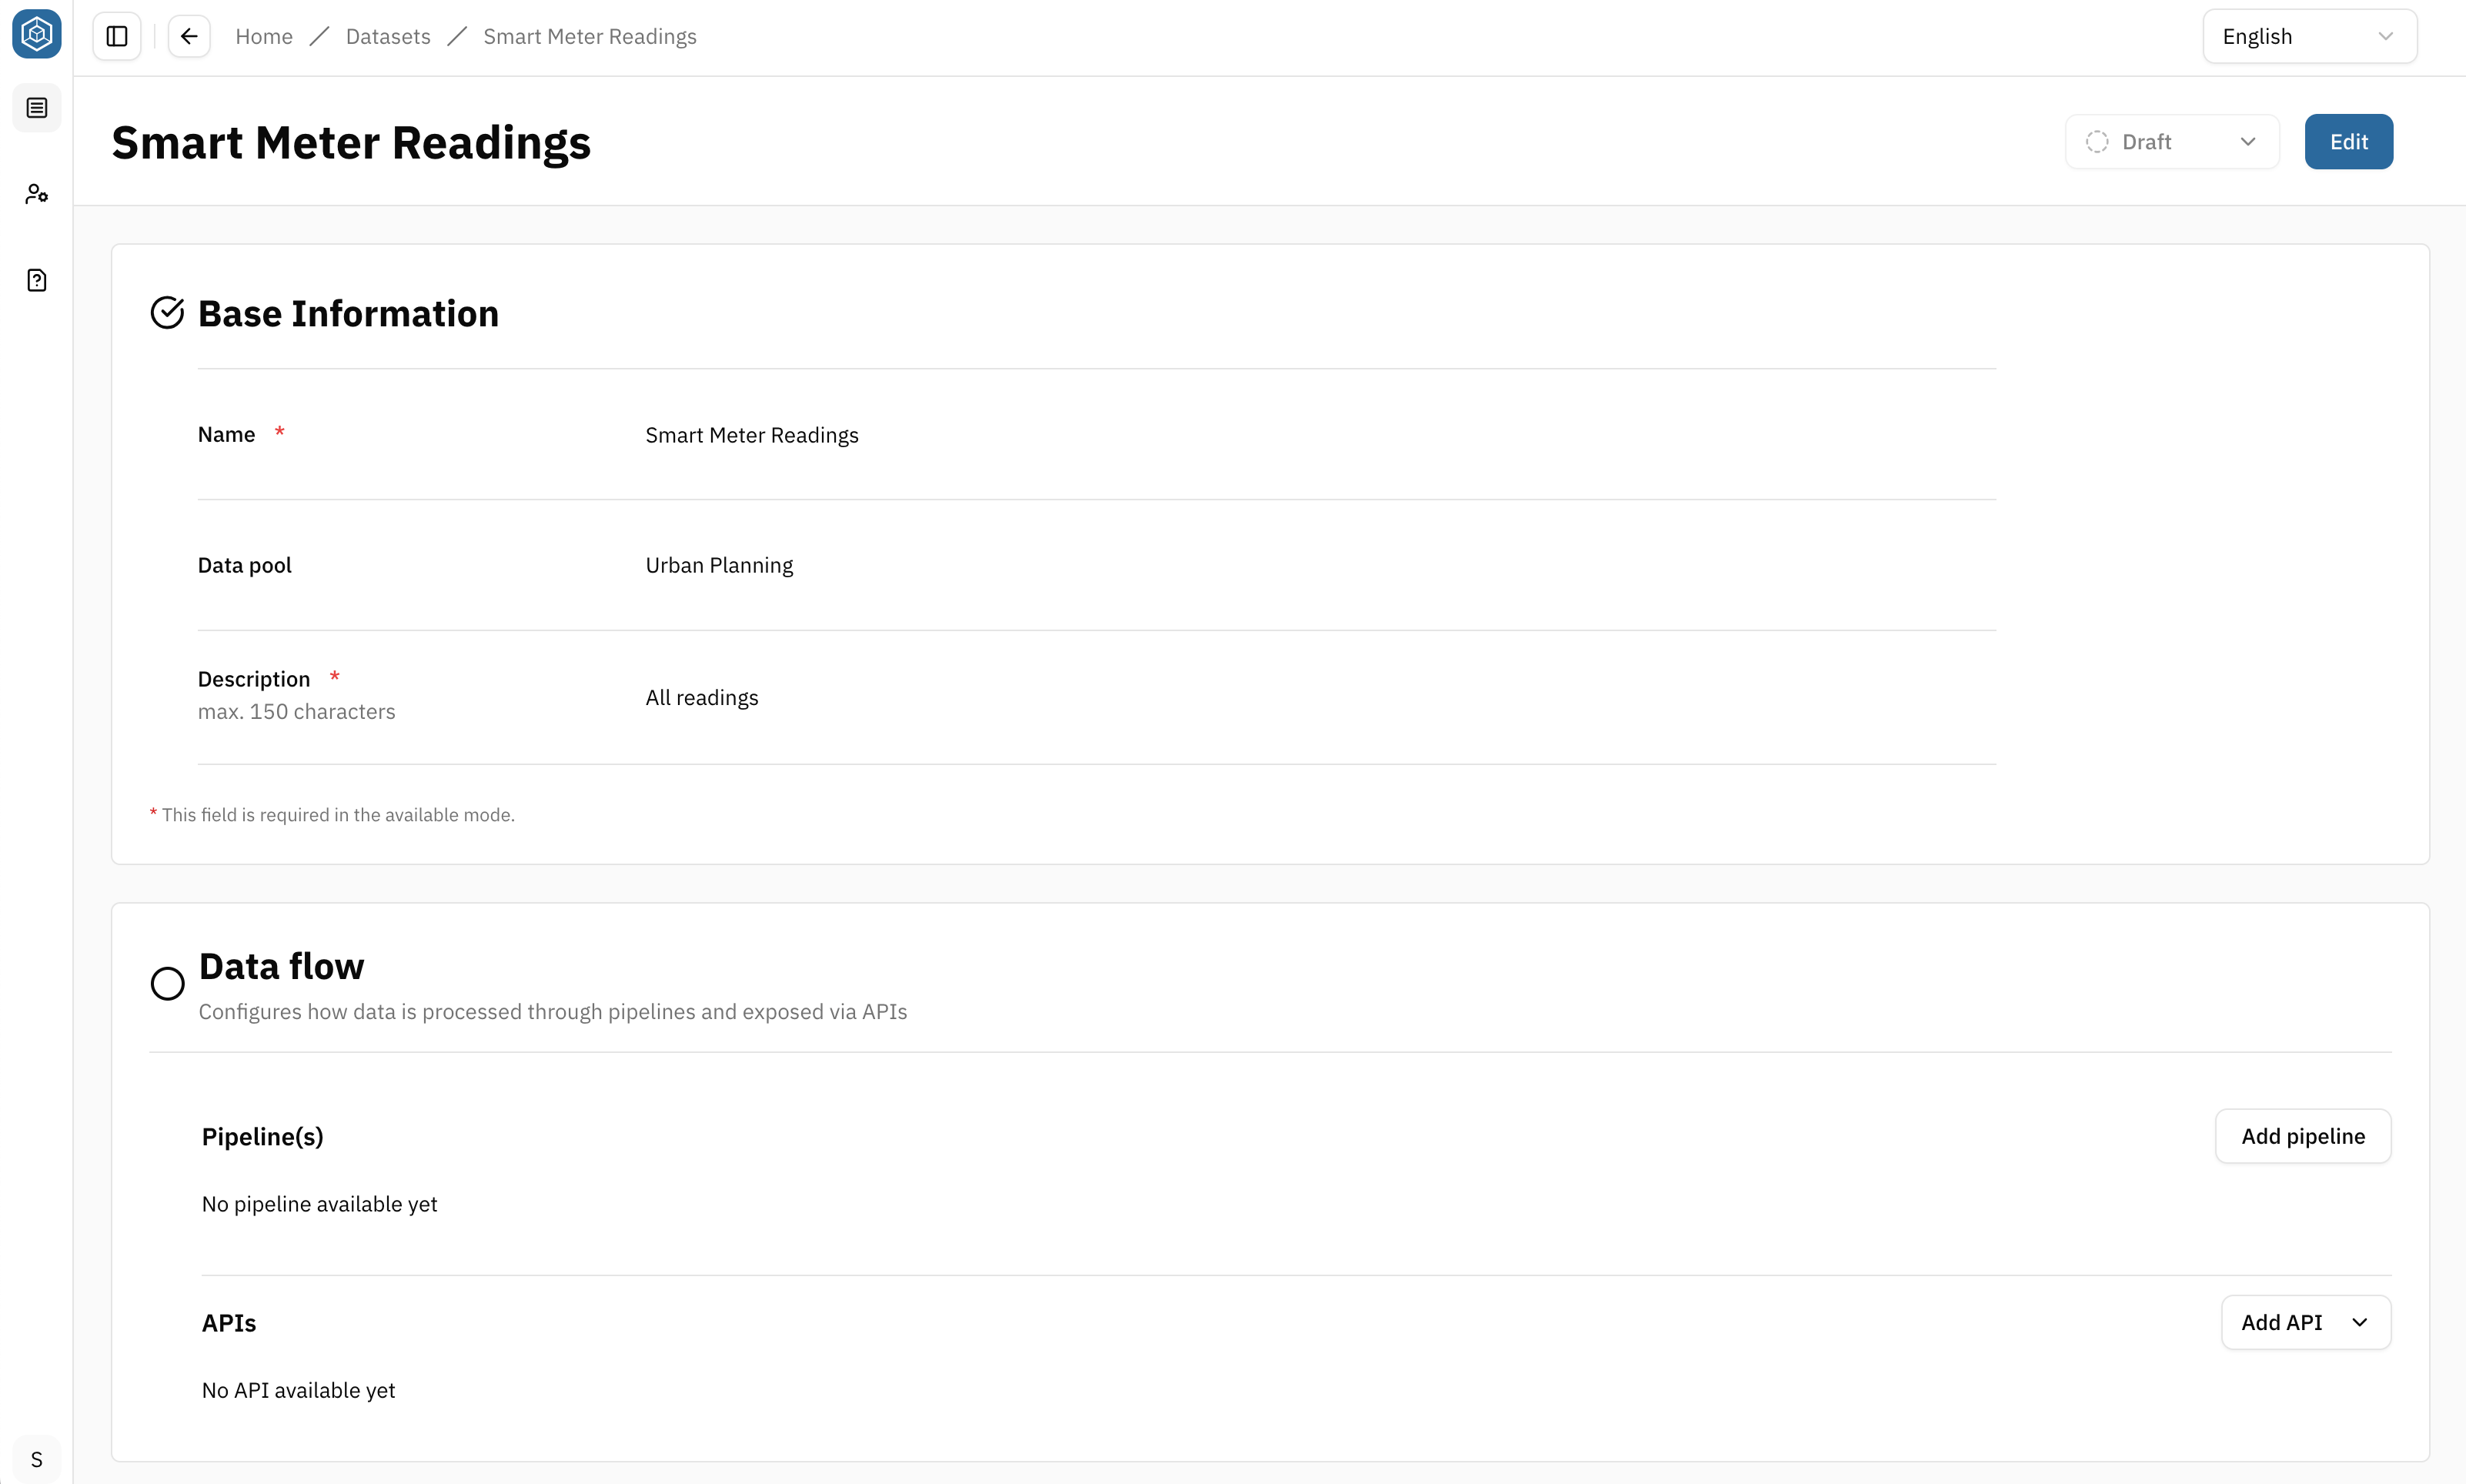
A pipeline is an automated sequence of steps used to ingest, transform, or provide data within the Platform. Pipelines are designed on a canvas-based interface that allows you to work freely. You can add, configure, move, and connect nodes in any order. Nodes and connections can be removed by selecting them and pressing the Delete key on your keyboard.
- Enter a name for the pipeline at the top of the canvas
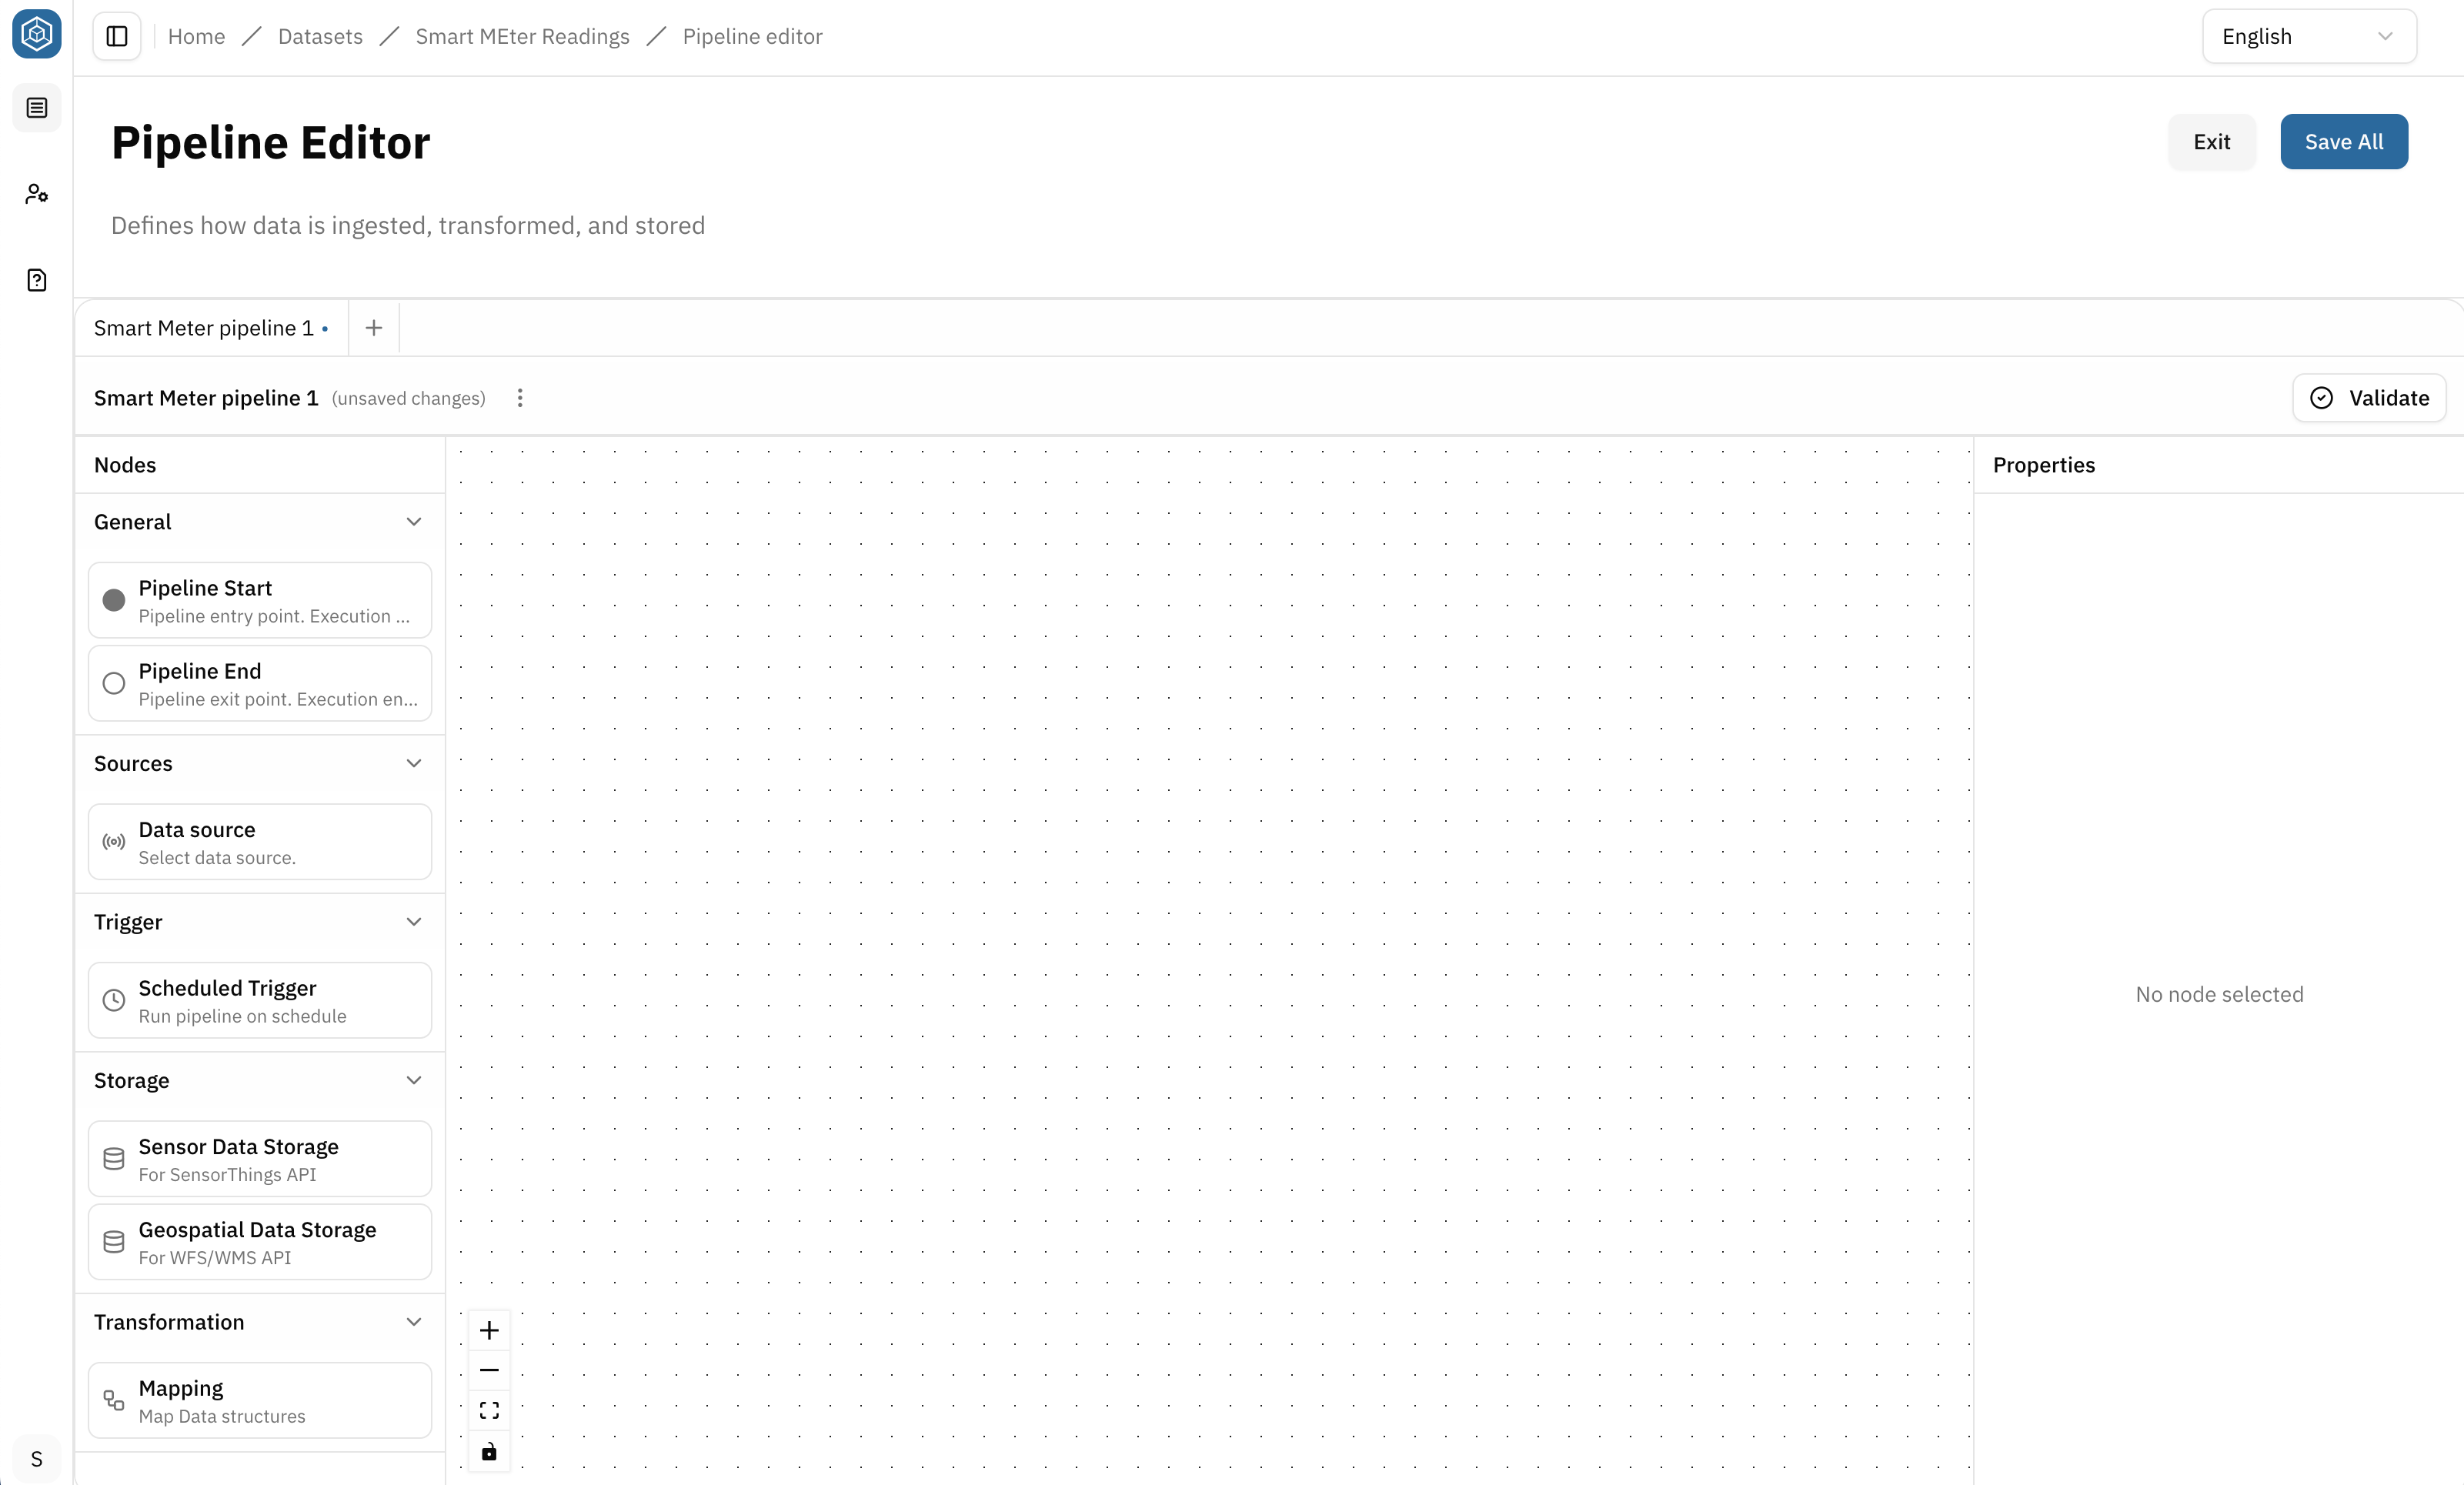
It helps you identify and manage multiple pipelines within a Dataset
- Add nodes to the canvas
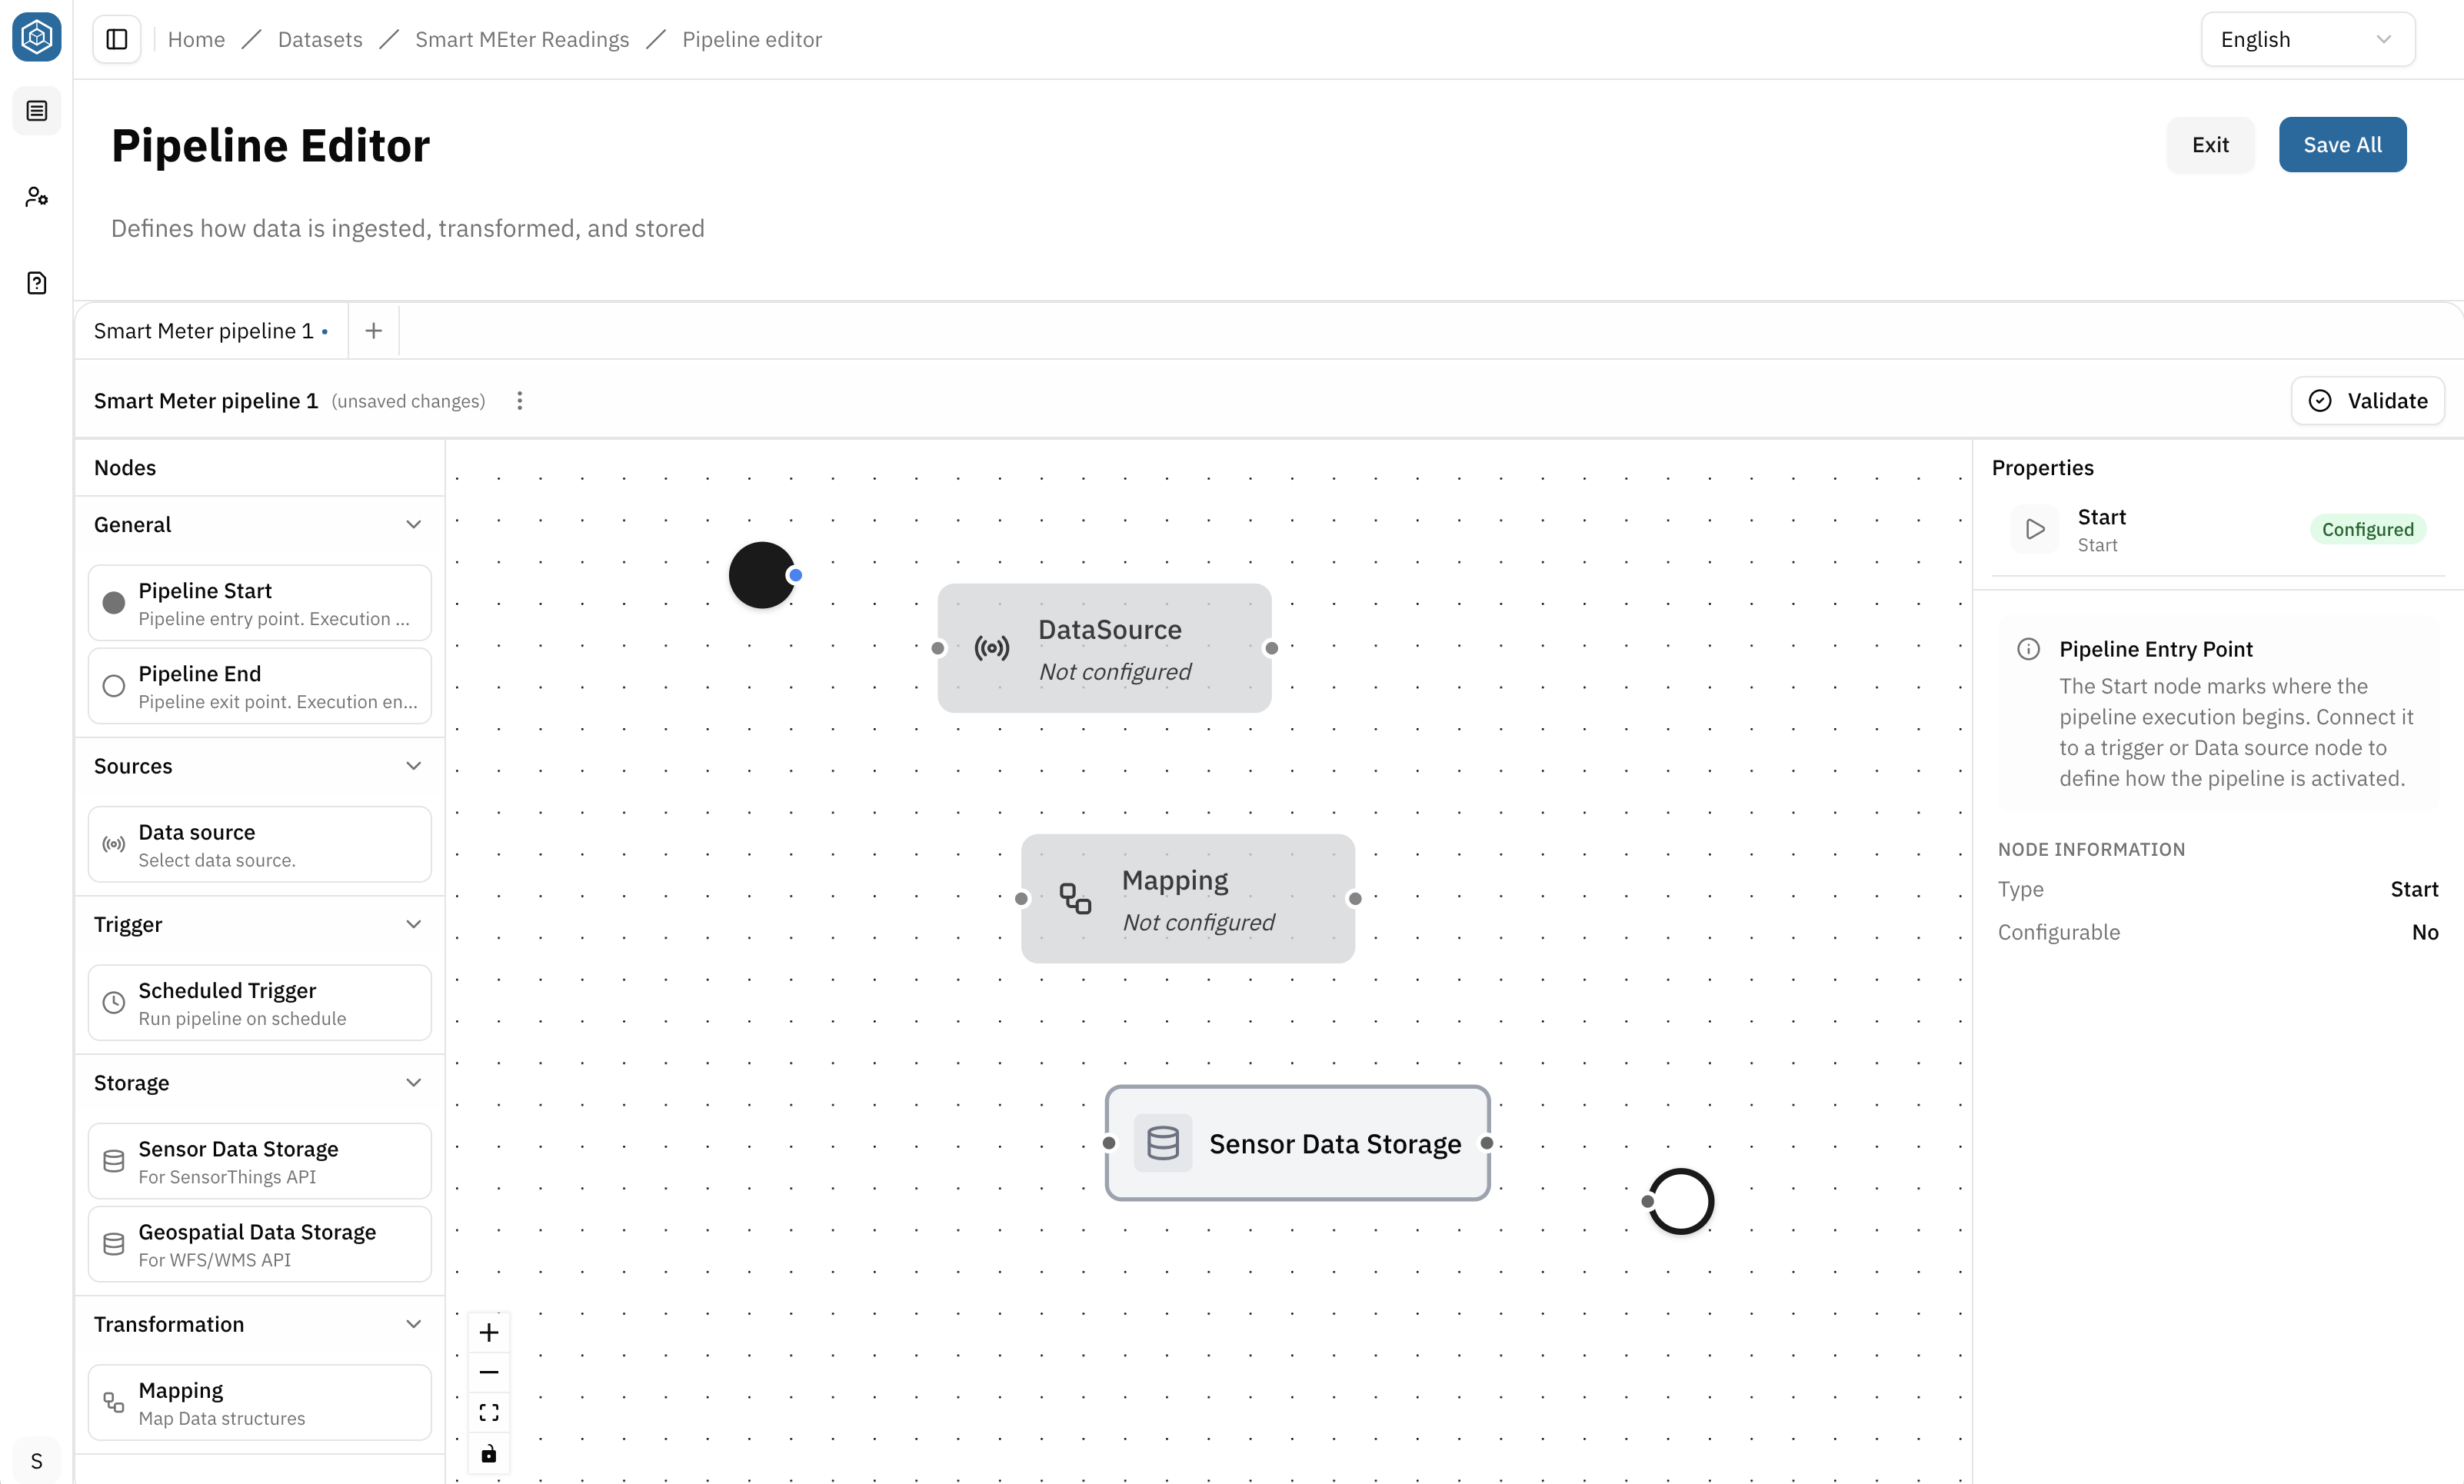
In CIVITAS/CORE, every pipeline has a defined structure:
- a Flow start → marks the beginning of the pipeline
- a Flow end → marks the end of the pipeline
Between these nodes, you define how data is loaded, transformed, and stored.
Pipelines are flexible:
- they can start with a Data source or be triggered by an event (e.g. schedule)
- they can include one or more transformation nodes (e.g. Mapping)
- they can store data in different storage backends depending on the use case
What matters:
- all nodes must be correctly connected
- all required node configurations must be completed
- the pipeline must pass validation
Example pipeline:
- Load and store data: Flow start → Data source → Mapping → Storage → Flow end
- Click on a node to configure it based on your use case
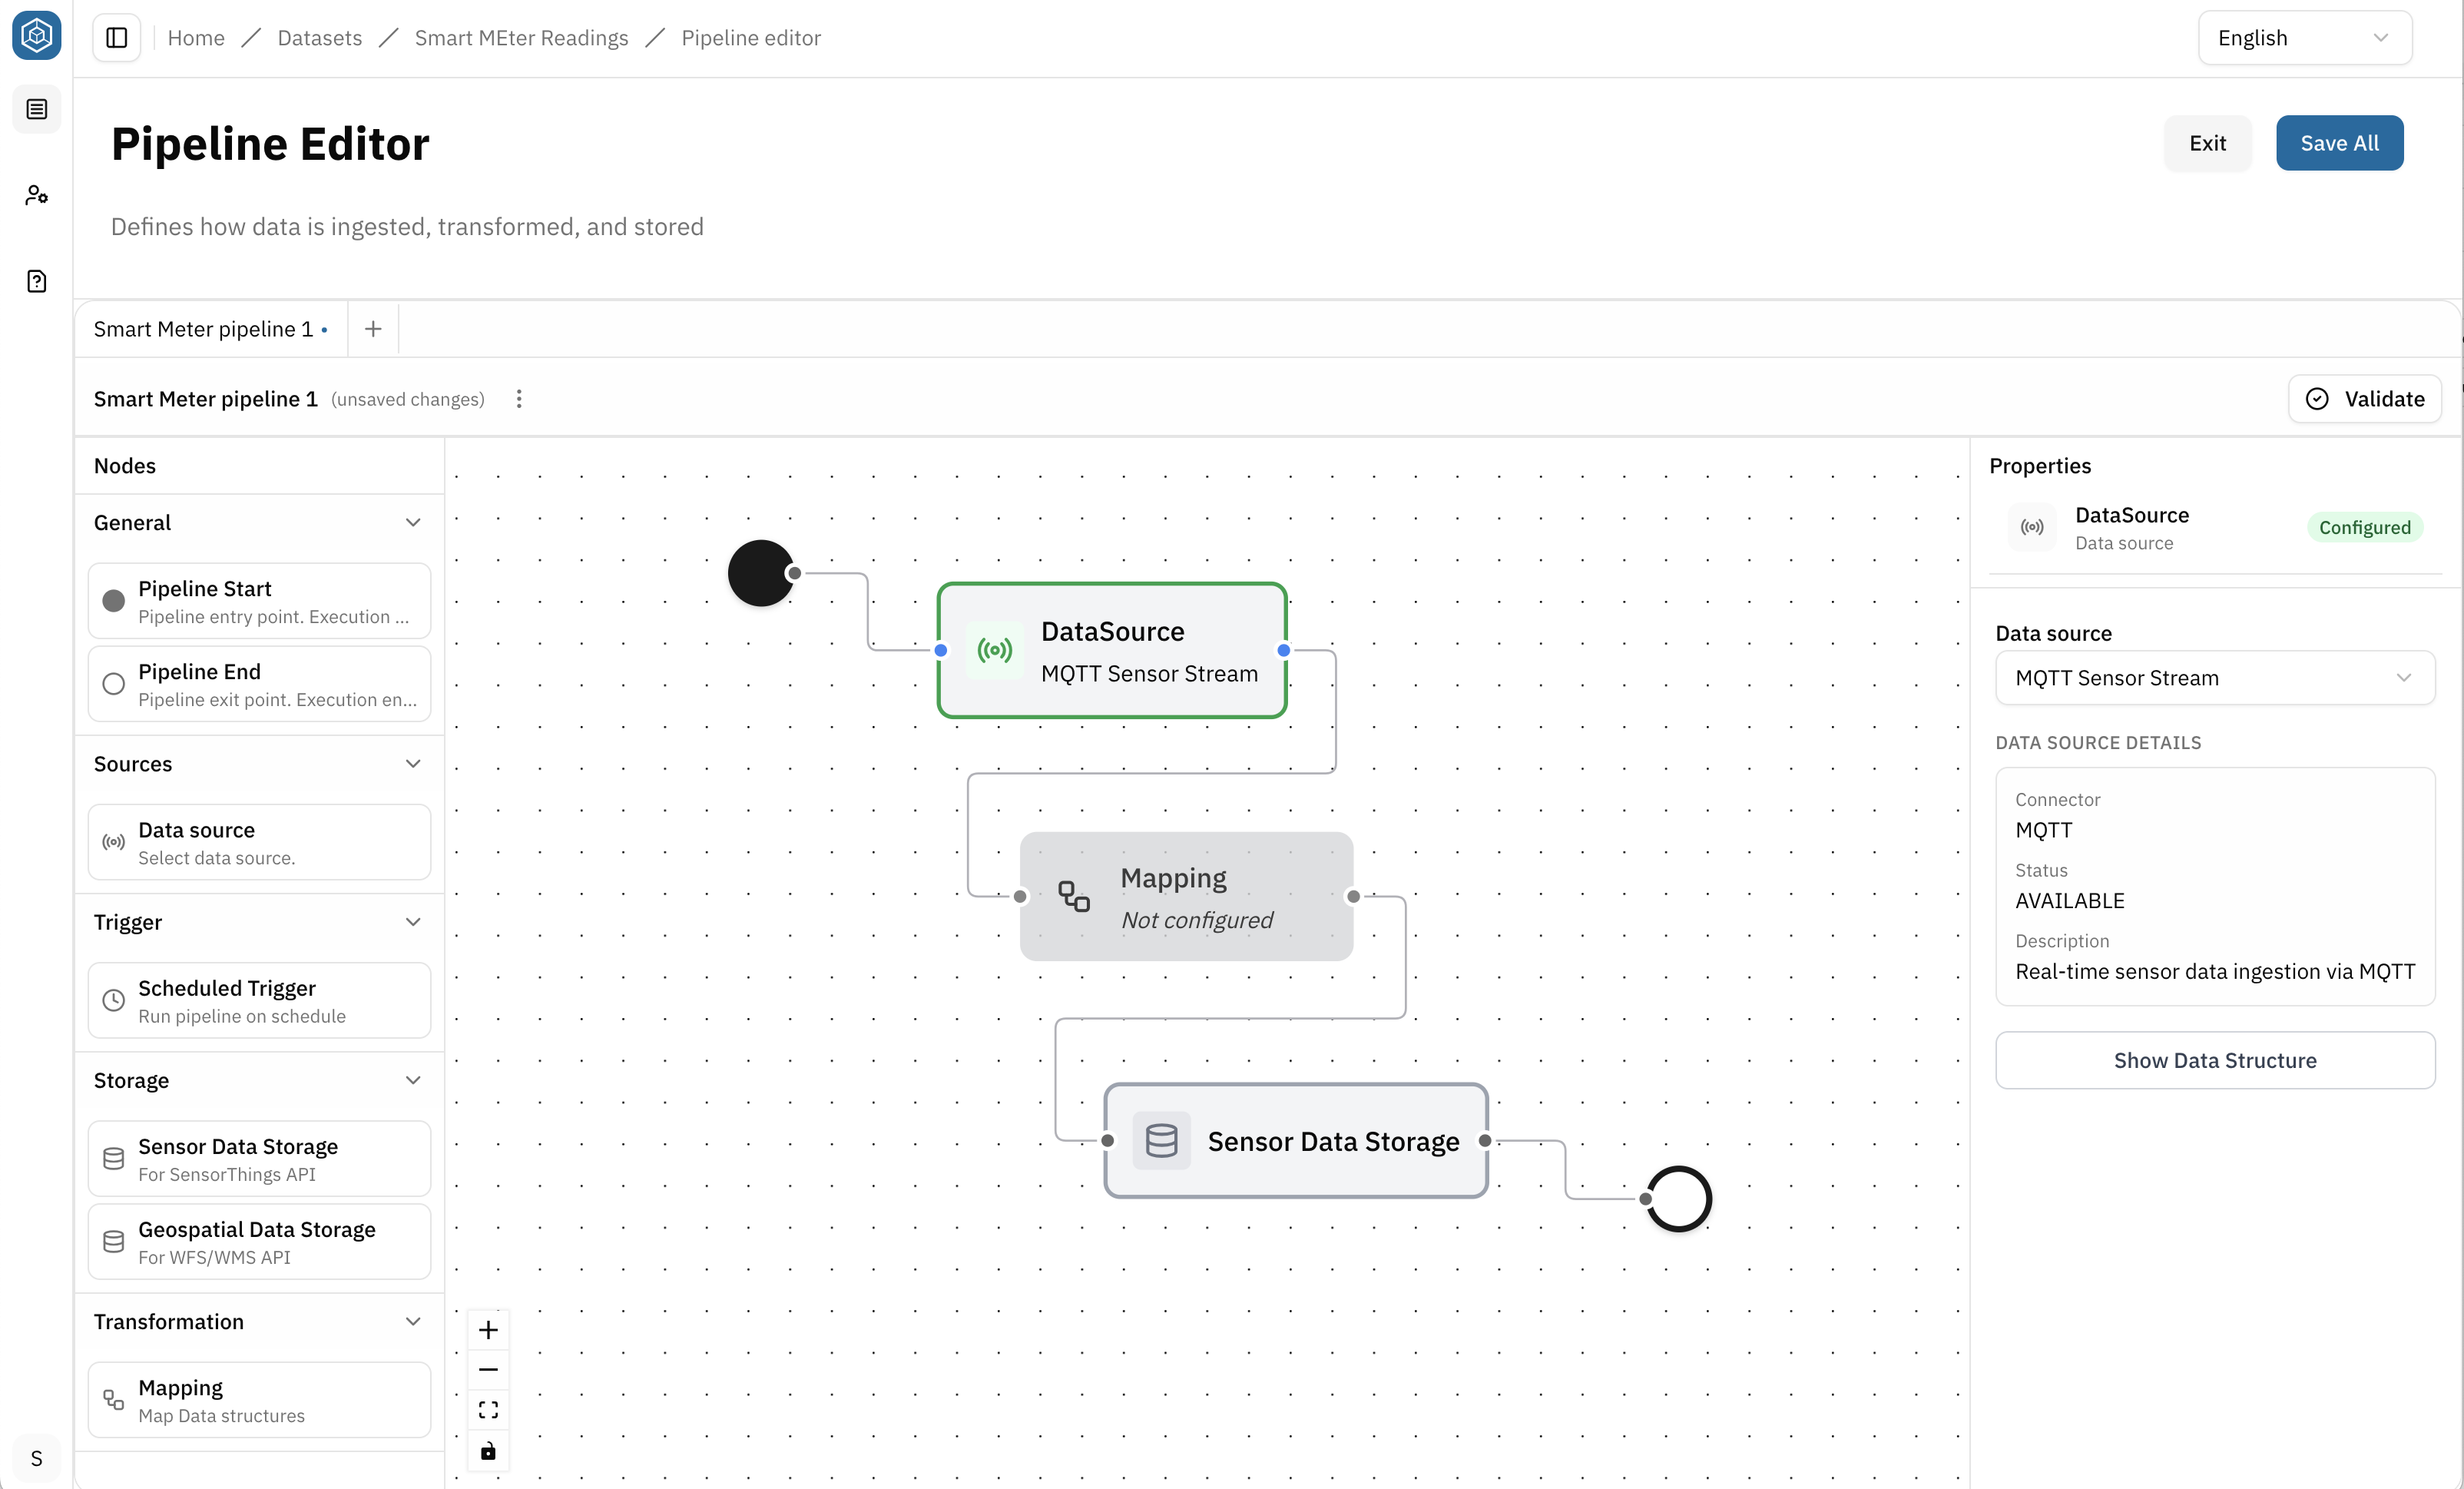
A Mapping transforms data from an input Data structure into an output Data structure.
To create a Mapping:
- Add a Mapping node to the Pipeline
- Select the Mapping node
- Choose an input Data structure
- Choose an output Data structure
- Open the Mapping Canvas
In the Mapping Canvas, you can:
- connect source and target attributes
- apply transformations where required
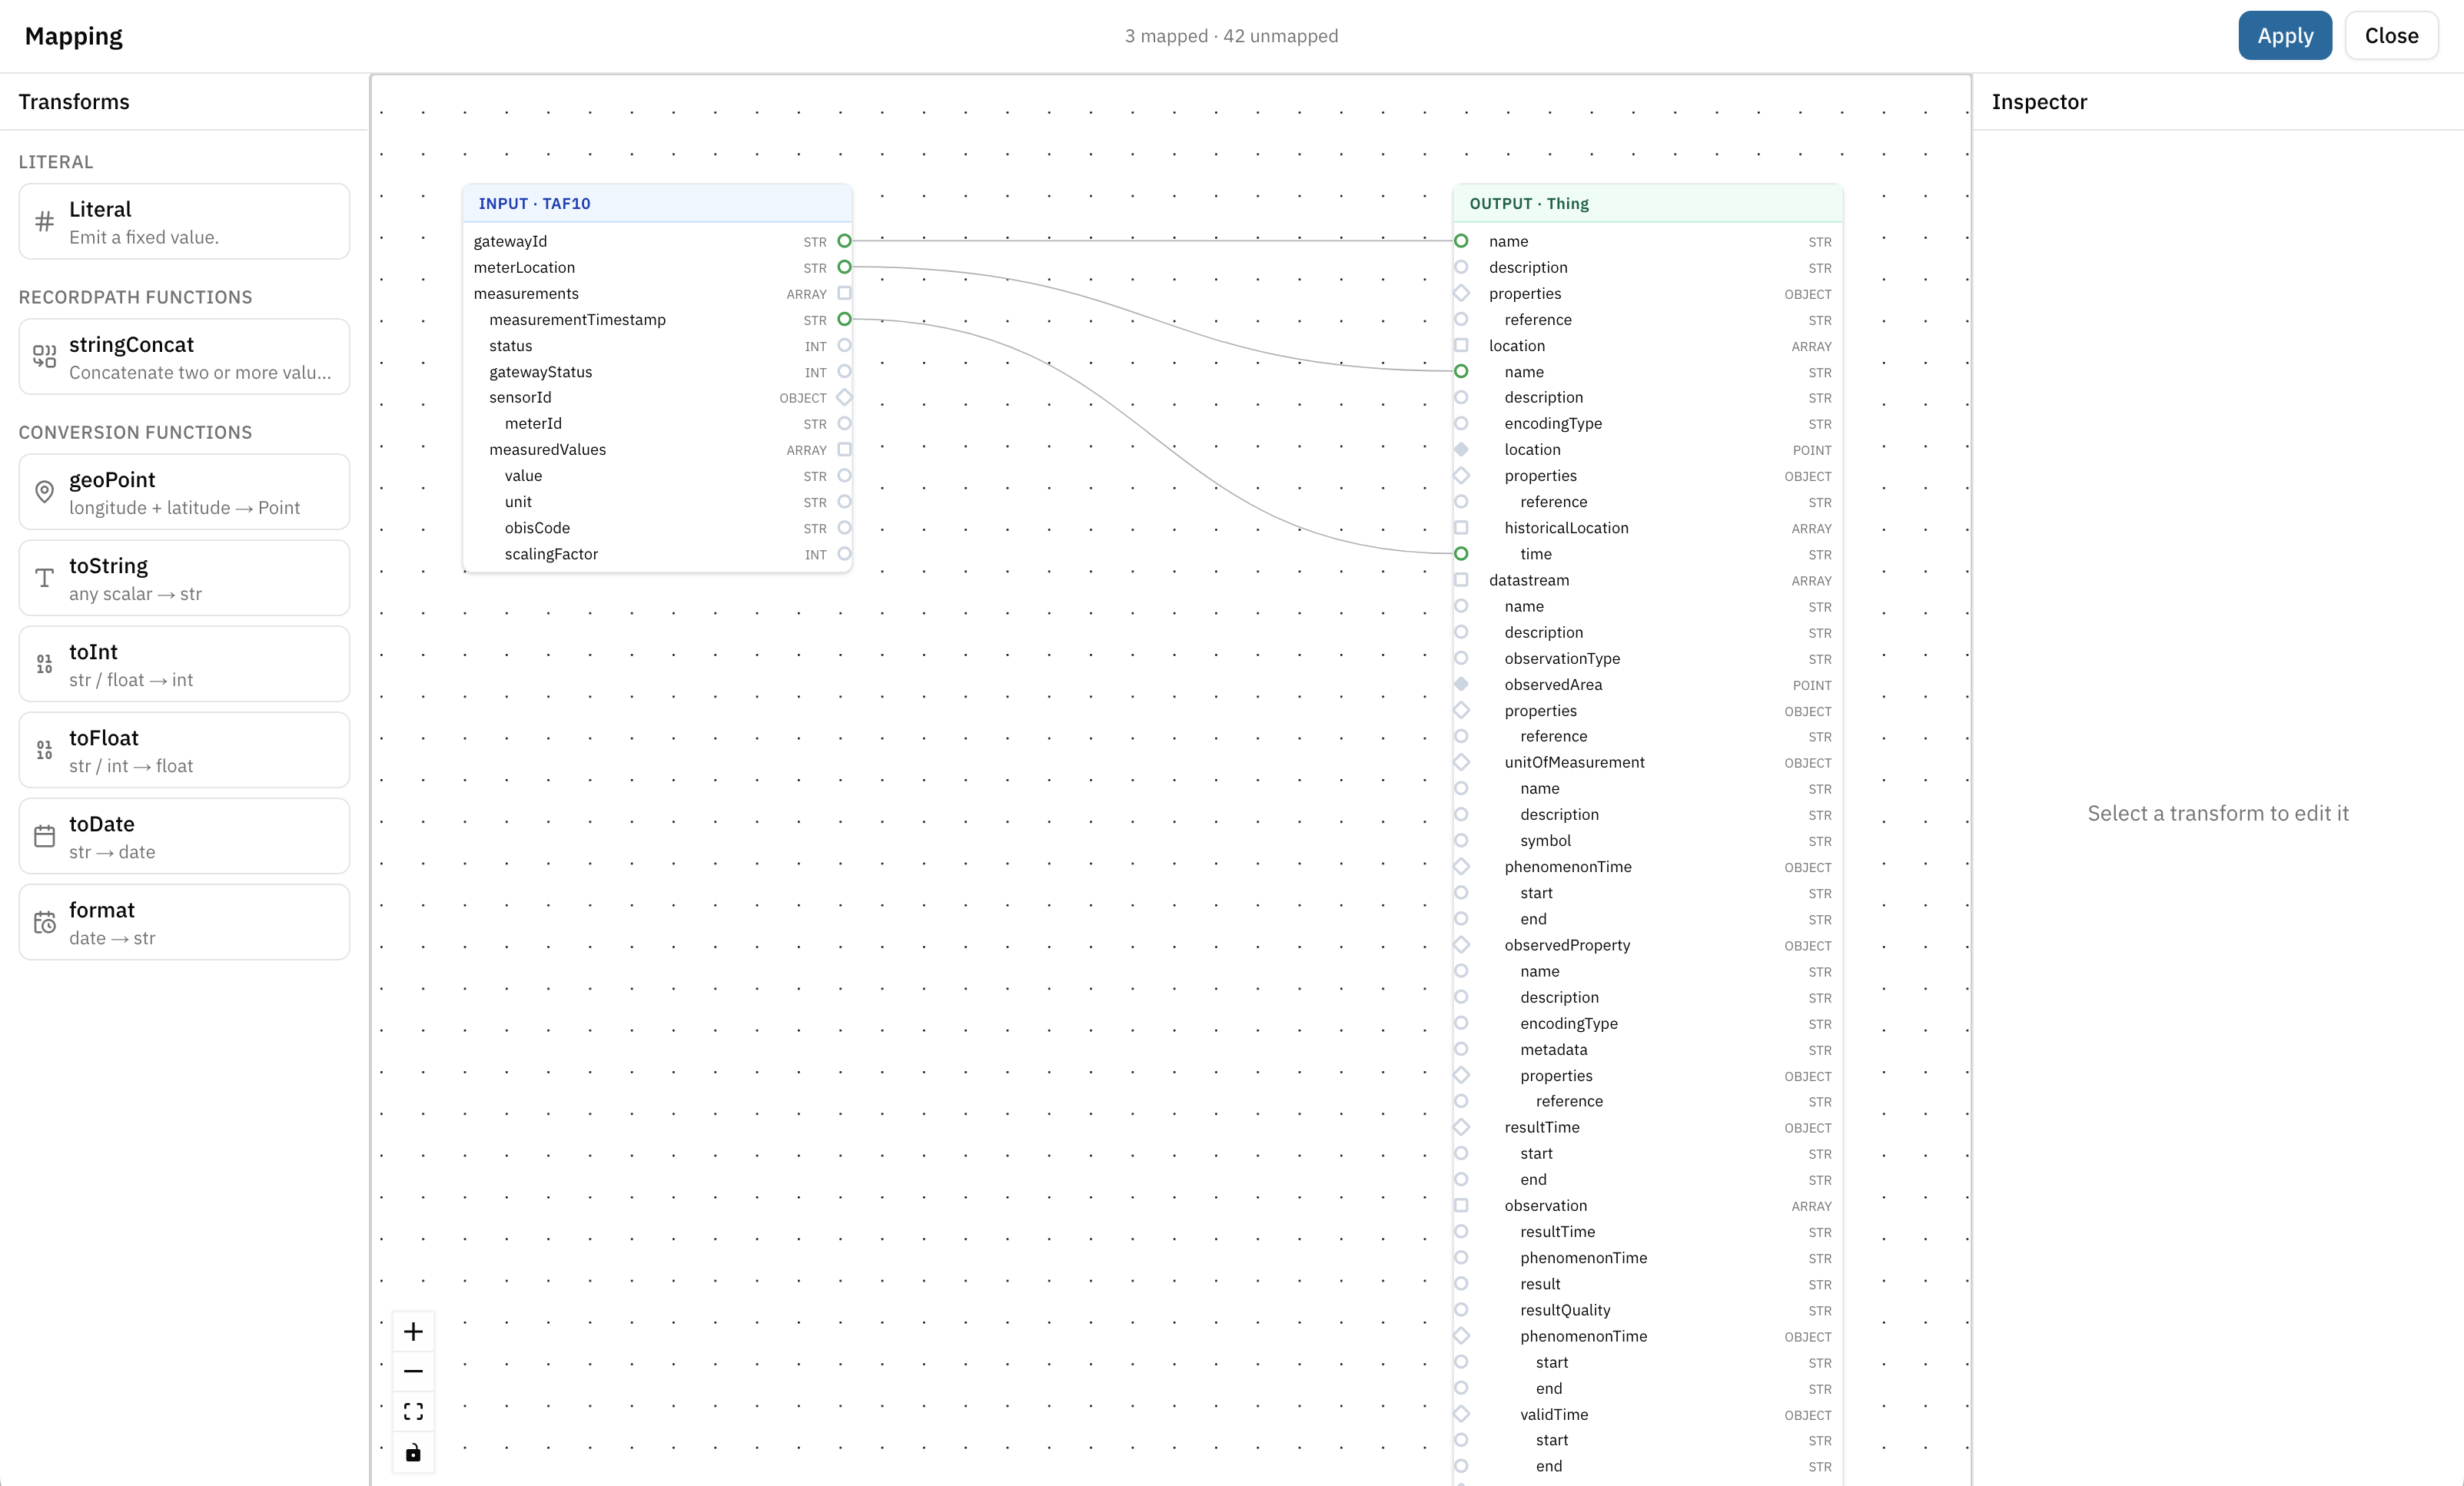
Before saving the Mapping:
- ensure all required target attributes are mapped
- verify that connected attributes use compatible data types
- resolve any validation issues
Once the Mapping passes validation:
- Hit Save
- Exit and Return to the Pipeline Canvas
- Connect all nodes to complete the pipeline
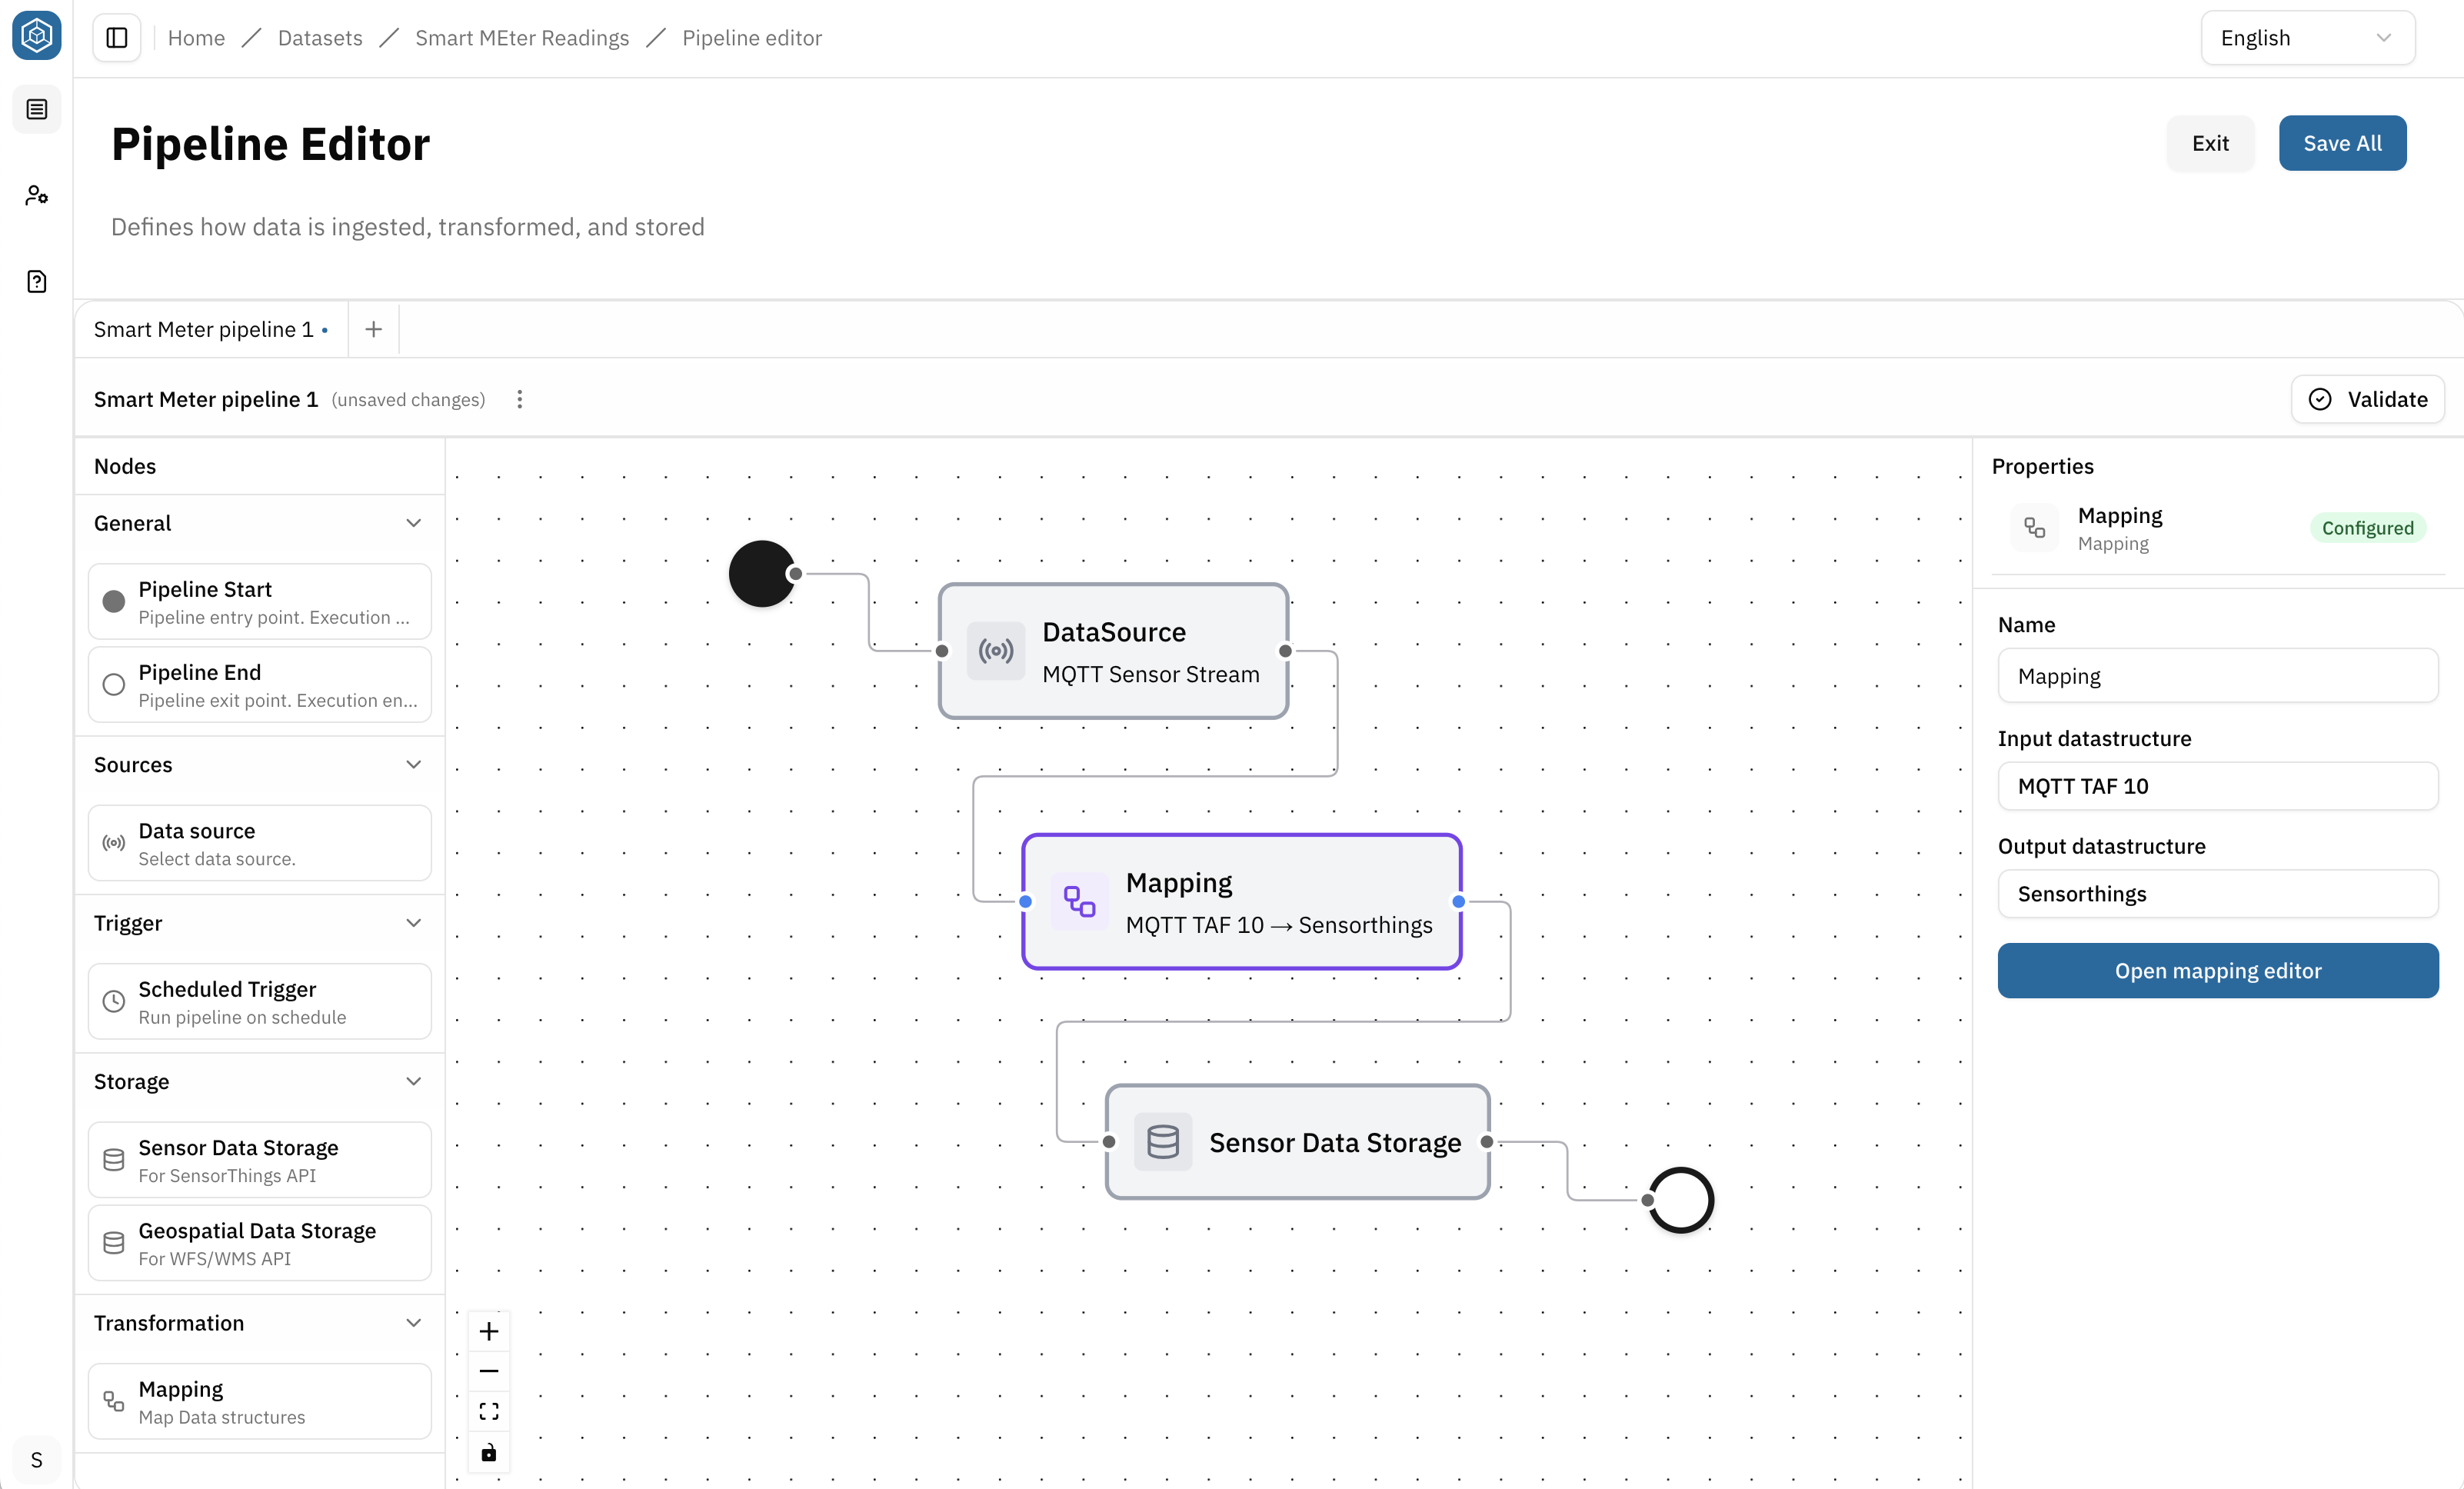
-
Click Validate to ensure that all nodes are correctly configured and connected
-
Fix any issues if needed, then hit Save and turn back to the detailview page of the Dataset
This use case requires two pipelines within the same Dataset:
- a master data pipeline
- a measurement data pipeline
Pipeline 1:
Start with the master data pipeline and follow the steps above. Use the configuration below as a reference.
Example pipeline name: Smart Meter Master Data
Pipeline structure: Flow start → Schedulded Trigger → Data source → Mapping → Storage → Flow end
Schedulded Trigger node: Defines when the pipeline runs. For example every 30 seconds:
*/30 * * * * *
Data source node: Assign the PostgreSQL Data source created earlier.
Mapping node: Transforms master data into SensorThings entities.
Sensor Data Storage node: Stores the transformed data in the SensorThings API backend.
Pipeline 2:
Now, open a new pipeline tab and define the measurement data pipeline. Follow the same steps as above and use the configuration below as a reference.
Example pipeline name: Smart Meter Measurement
Pipeline structure: Flow start → Data source → Mapping → Storage → Flow end
Data source node: Assign the MQTT Data source created earlier.
Mapping node: Transform incoming messages into Observations.
Sensor Data Storage node: Stores the transformed Observations in the SensorThings API backend.
Step 3: Define an API
→ An API provides access to the Payload (actual Data) stored by a Dataset and allows consumers to retrieve it through a dedicated API URL.
Once a valid Pipeline exists and data is persisted using a Storage node, an API can be created for the Dataset.
To create an API
- Open the Dataset
- Navigate to Dataflow section → APIs
- Select Add API
- Choose an API type
- A form opens: Enter Title and Description (optional)
- Hit Save
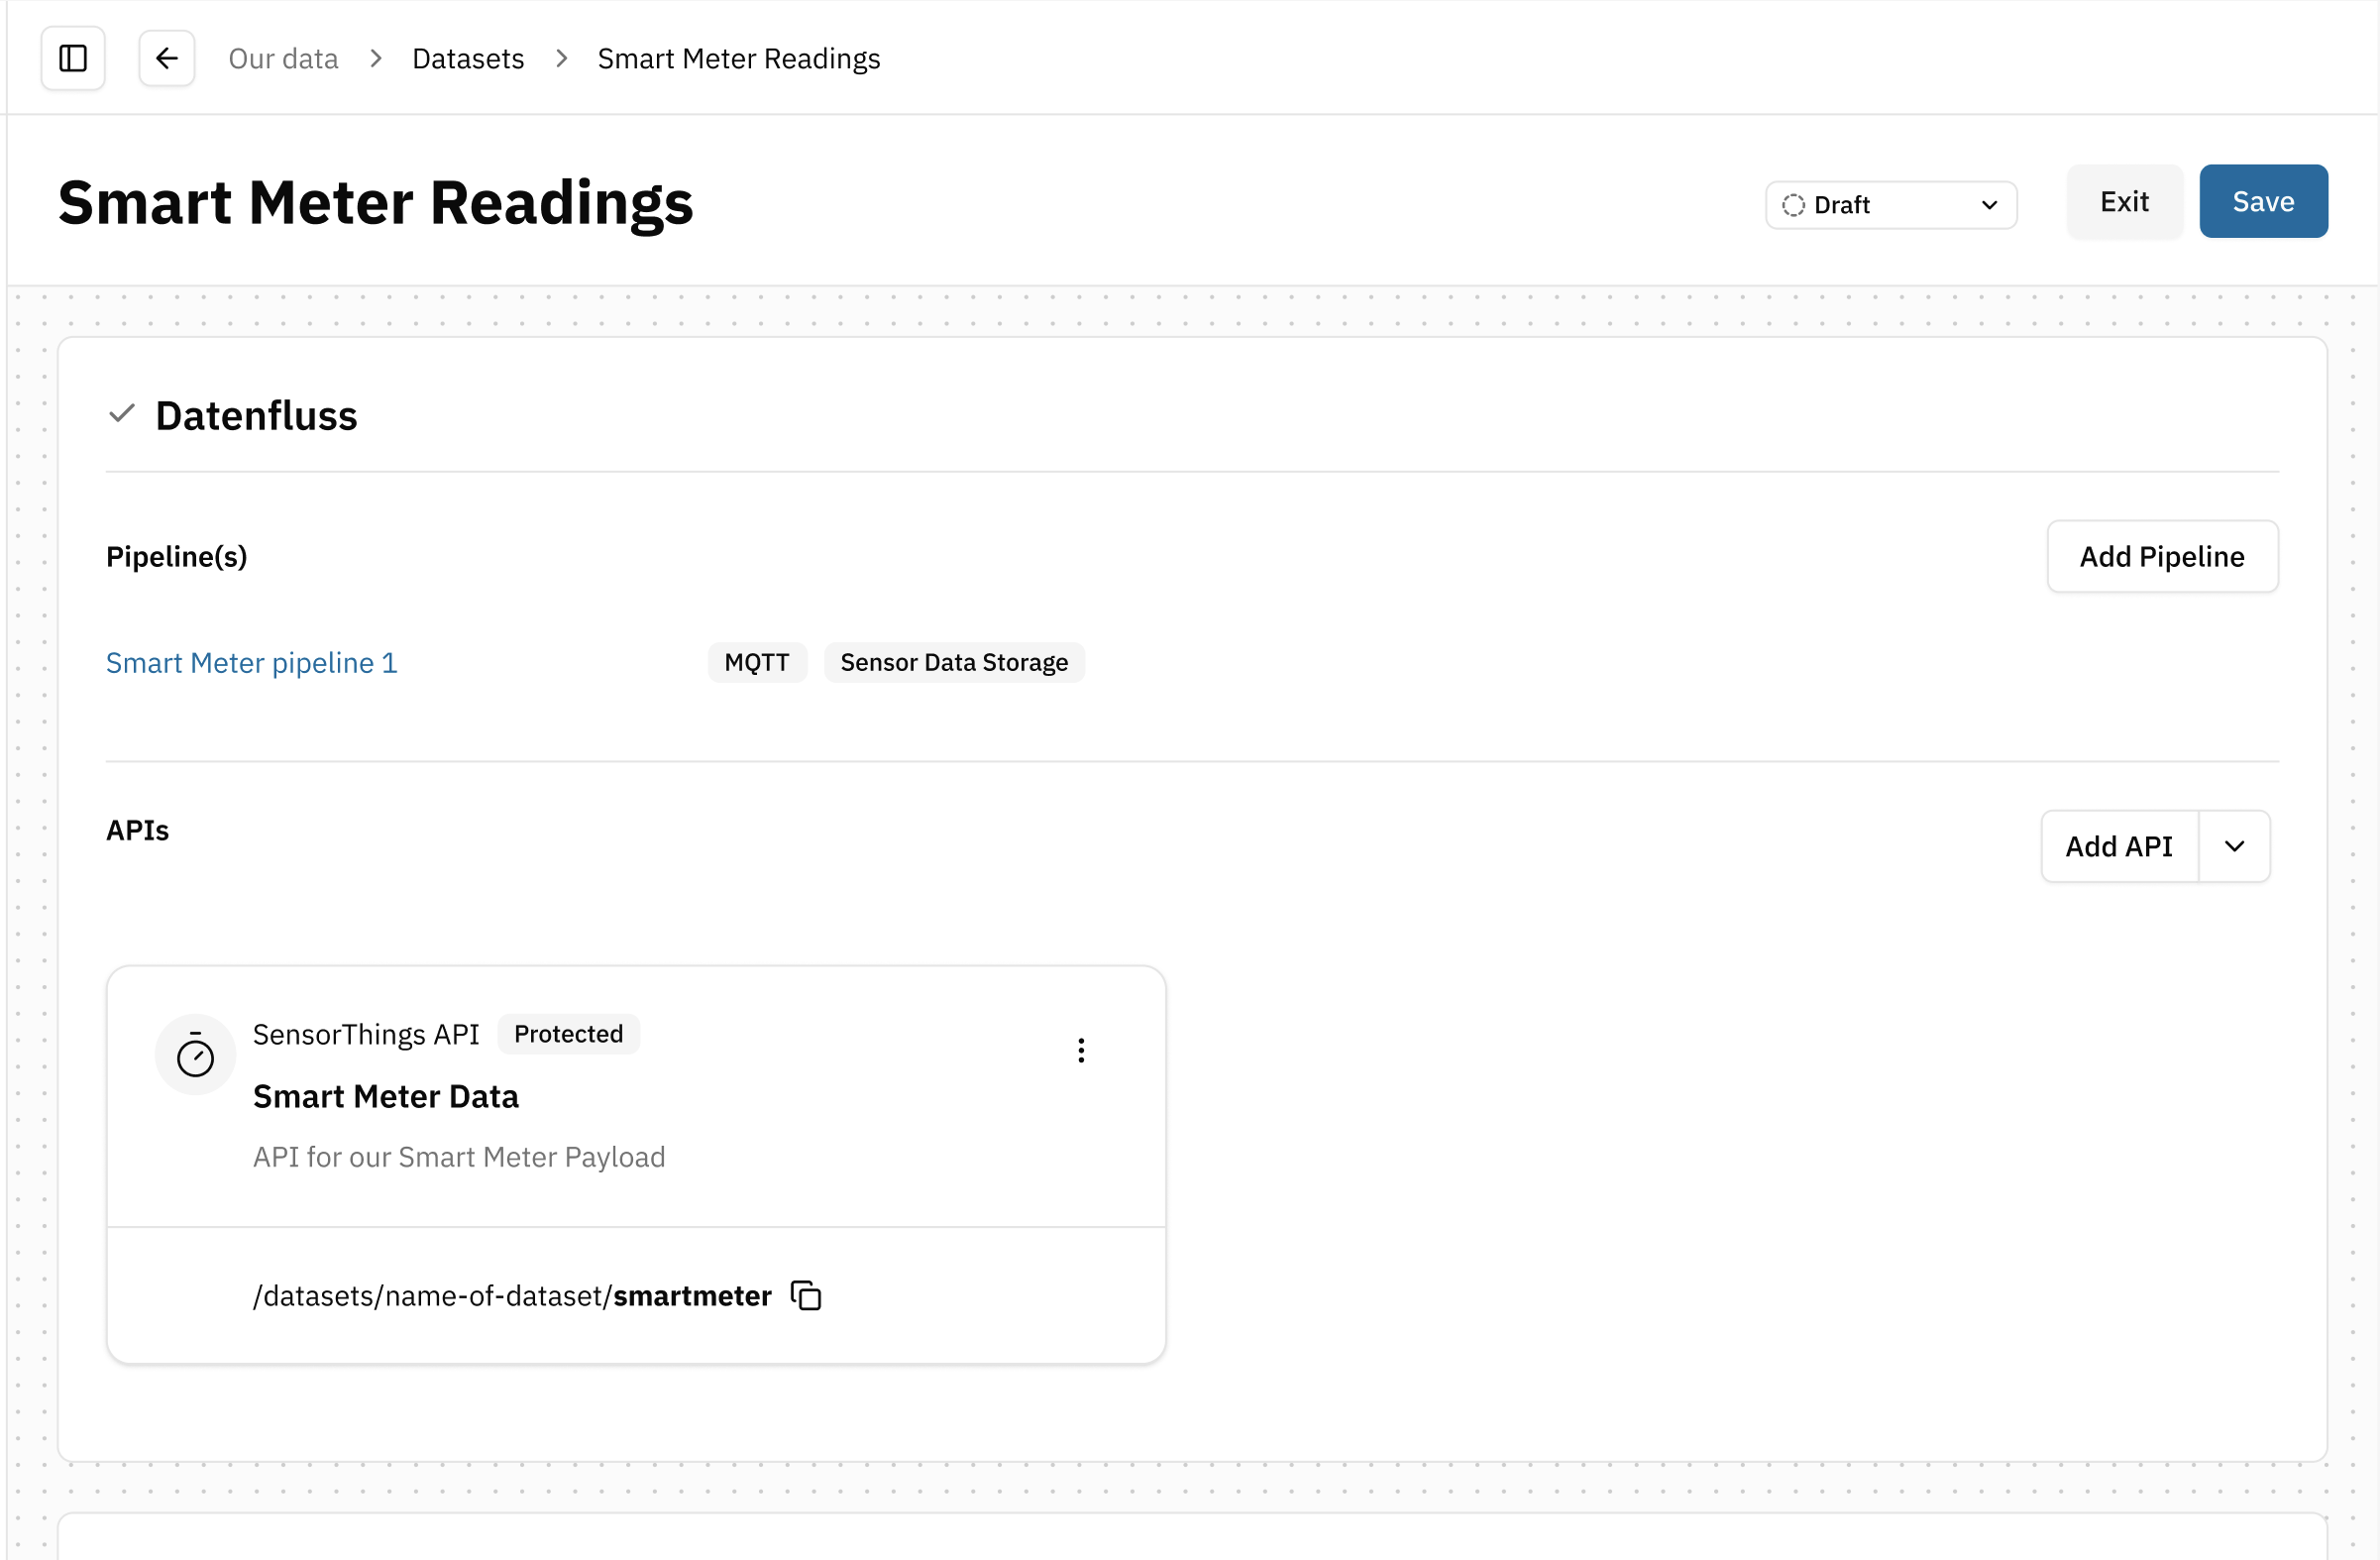
Available API types depend on the Storage nodes used in the Dataset's Pipelines. An API type can only be selected if data is stored using a compatible Storage node.
Examples: Sensor Data Storage → SensorThings API, Geospatial Data Storage → WFS/WMS API
After closing the form, a new API tile is created in the APIs section of the Dataset overview.
The tile displays:
- API name
- type
- optional description
- API URL
→ The API URL can be copied and shared with consumers.
Edit the API:
- Select the tile to reopen the API configuration form and update its settings
Delete the API:
- open the actions menu (⋯) on the API tile and select Delete
For this use case, select: SensorThings API – Time-series Data. This API type provides access to the time-series data persisted by the Pipeline in the Sensor Data Storage node.
Step 4: Open and manage access permissions
Permissions can be granted at different levels:
- Platform-wide through Data Roles assigned in Tenant Management
- Through permission inheritance from the assigned Datapool
- Directly on the Dataset
Configure permissions on the Dataset only when Dataset-specific access is required.
- Click Edit Groups and Roles in the section Access Management
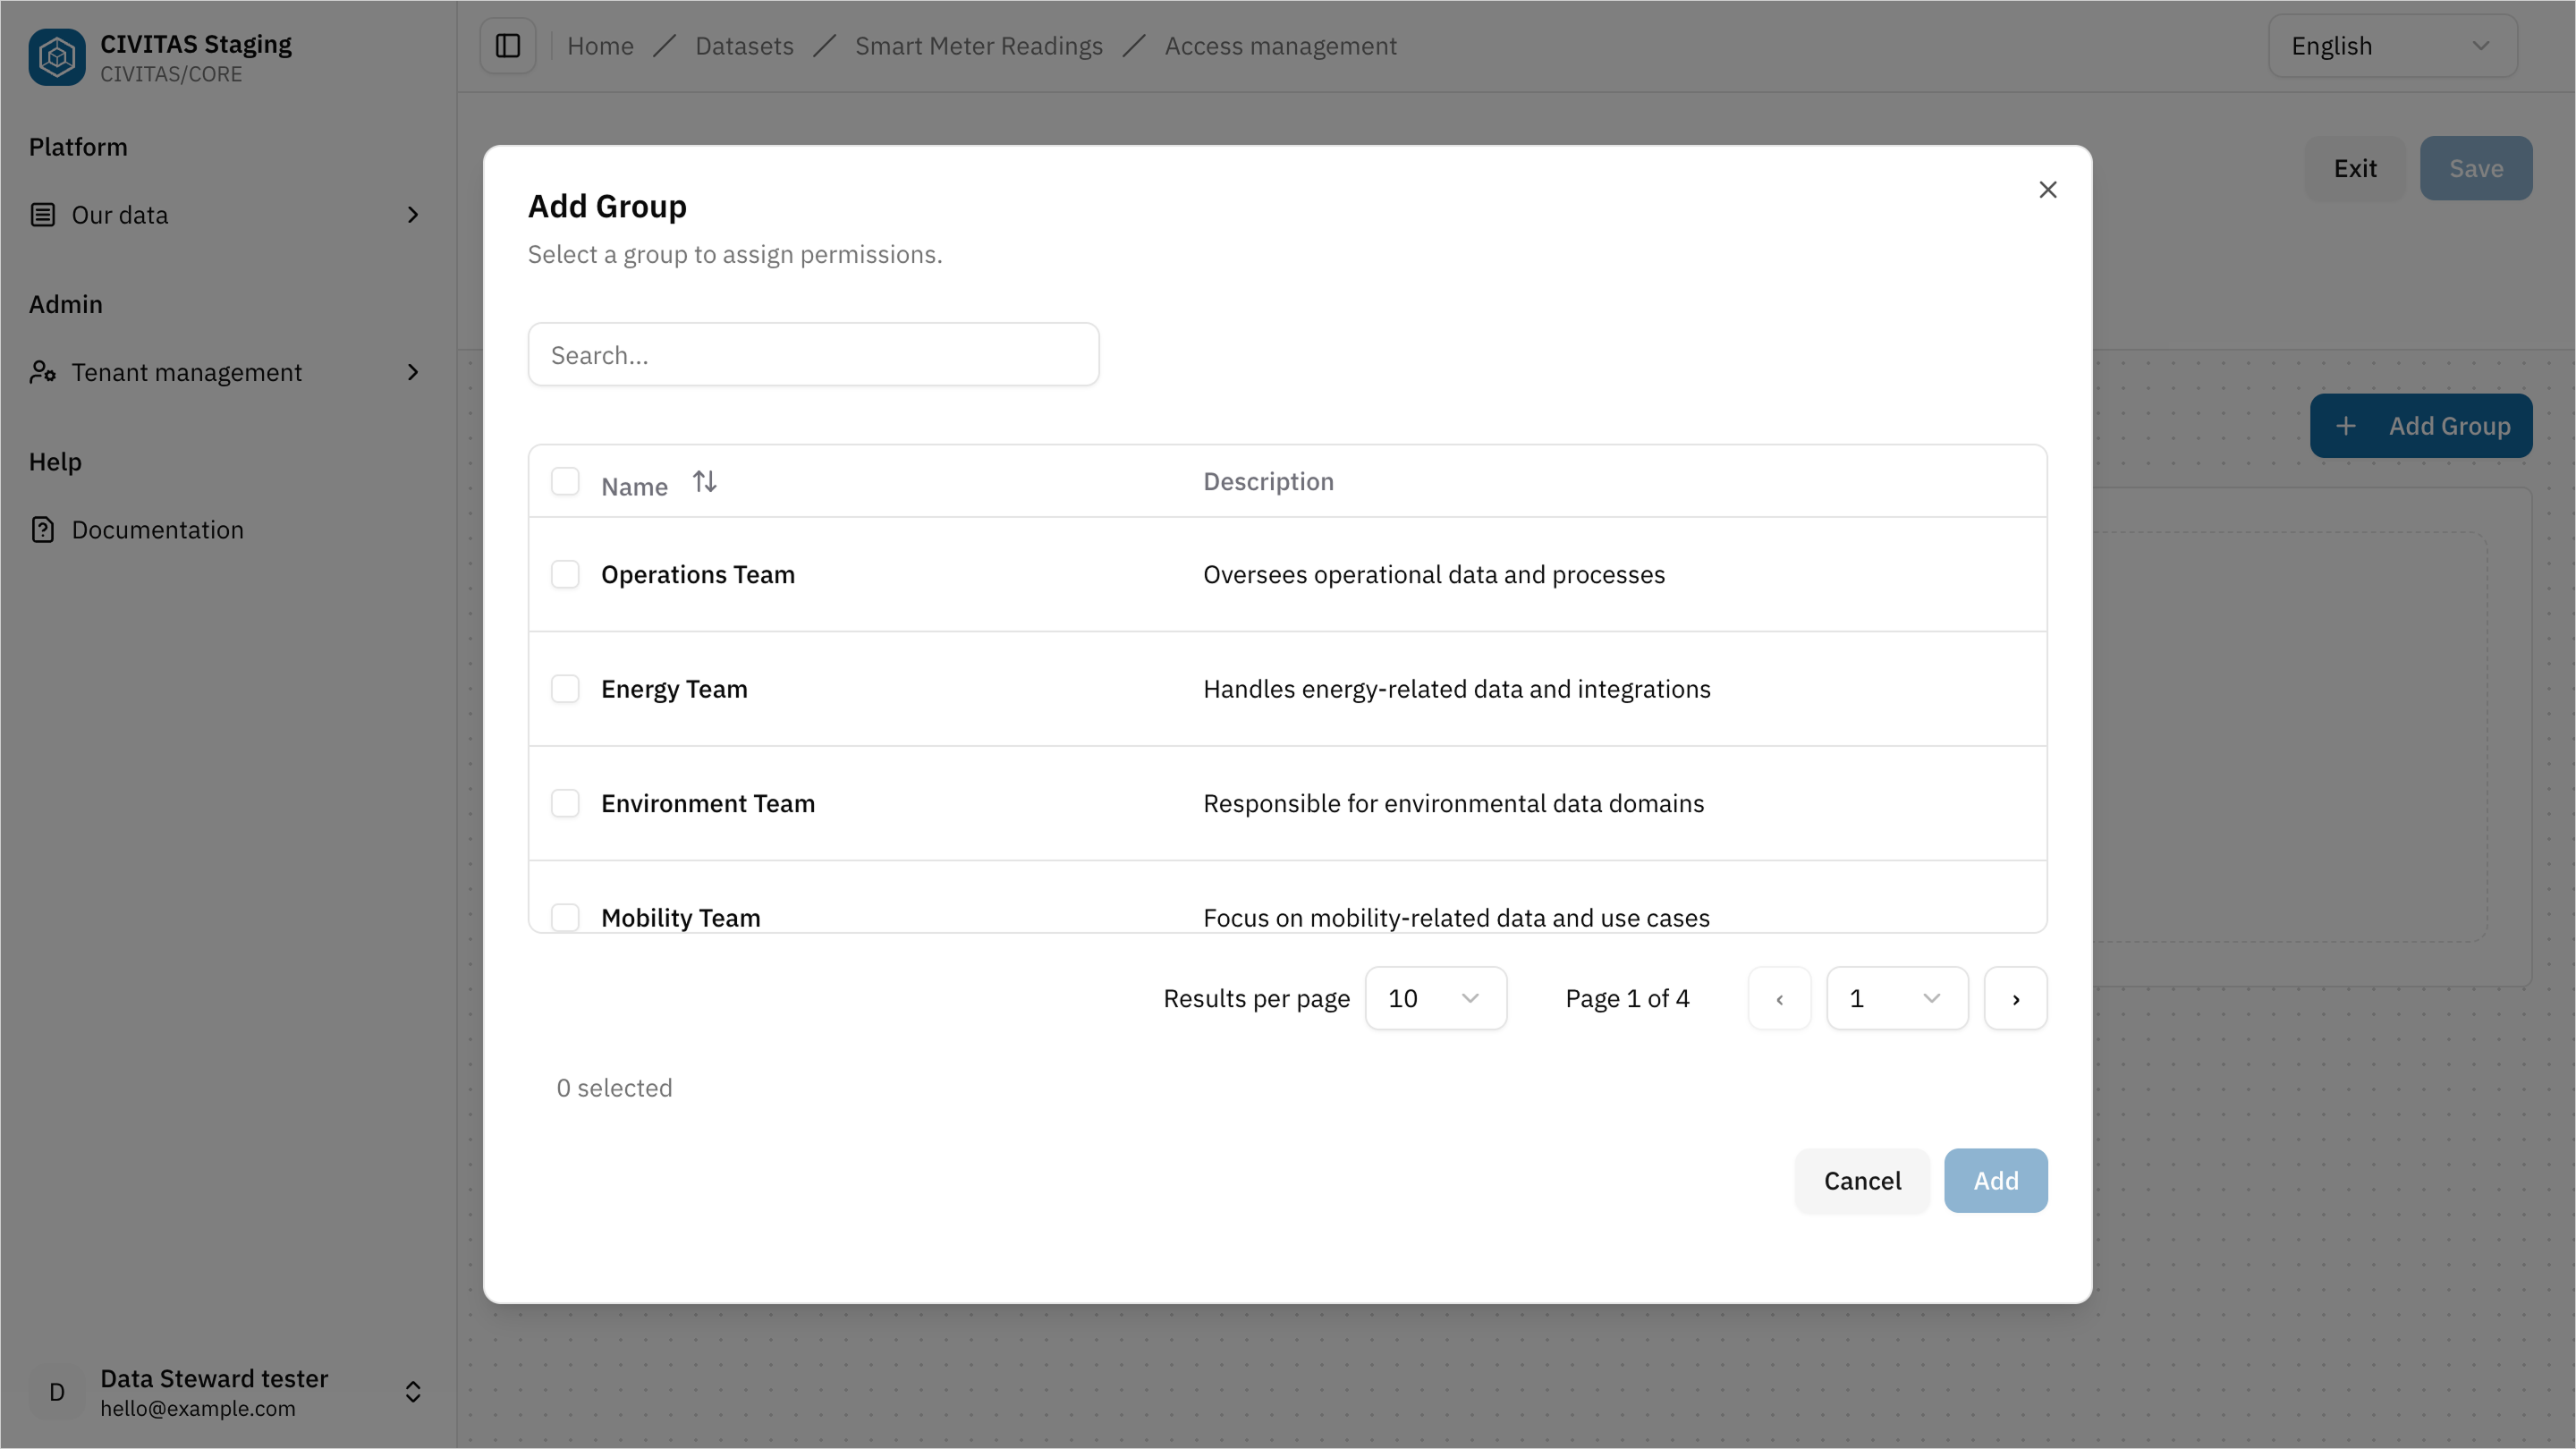
- Add a Group
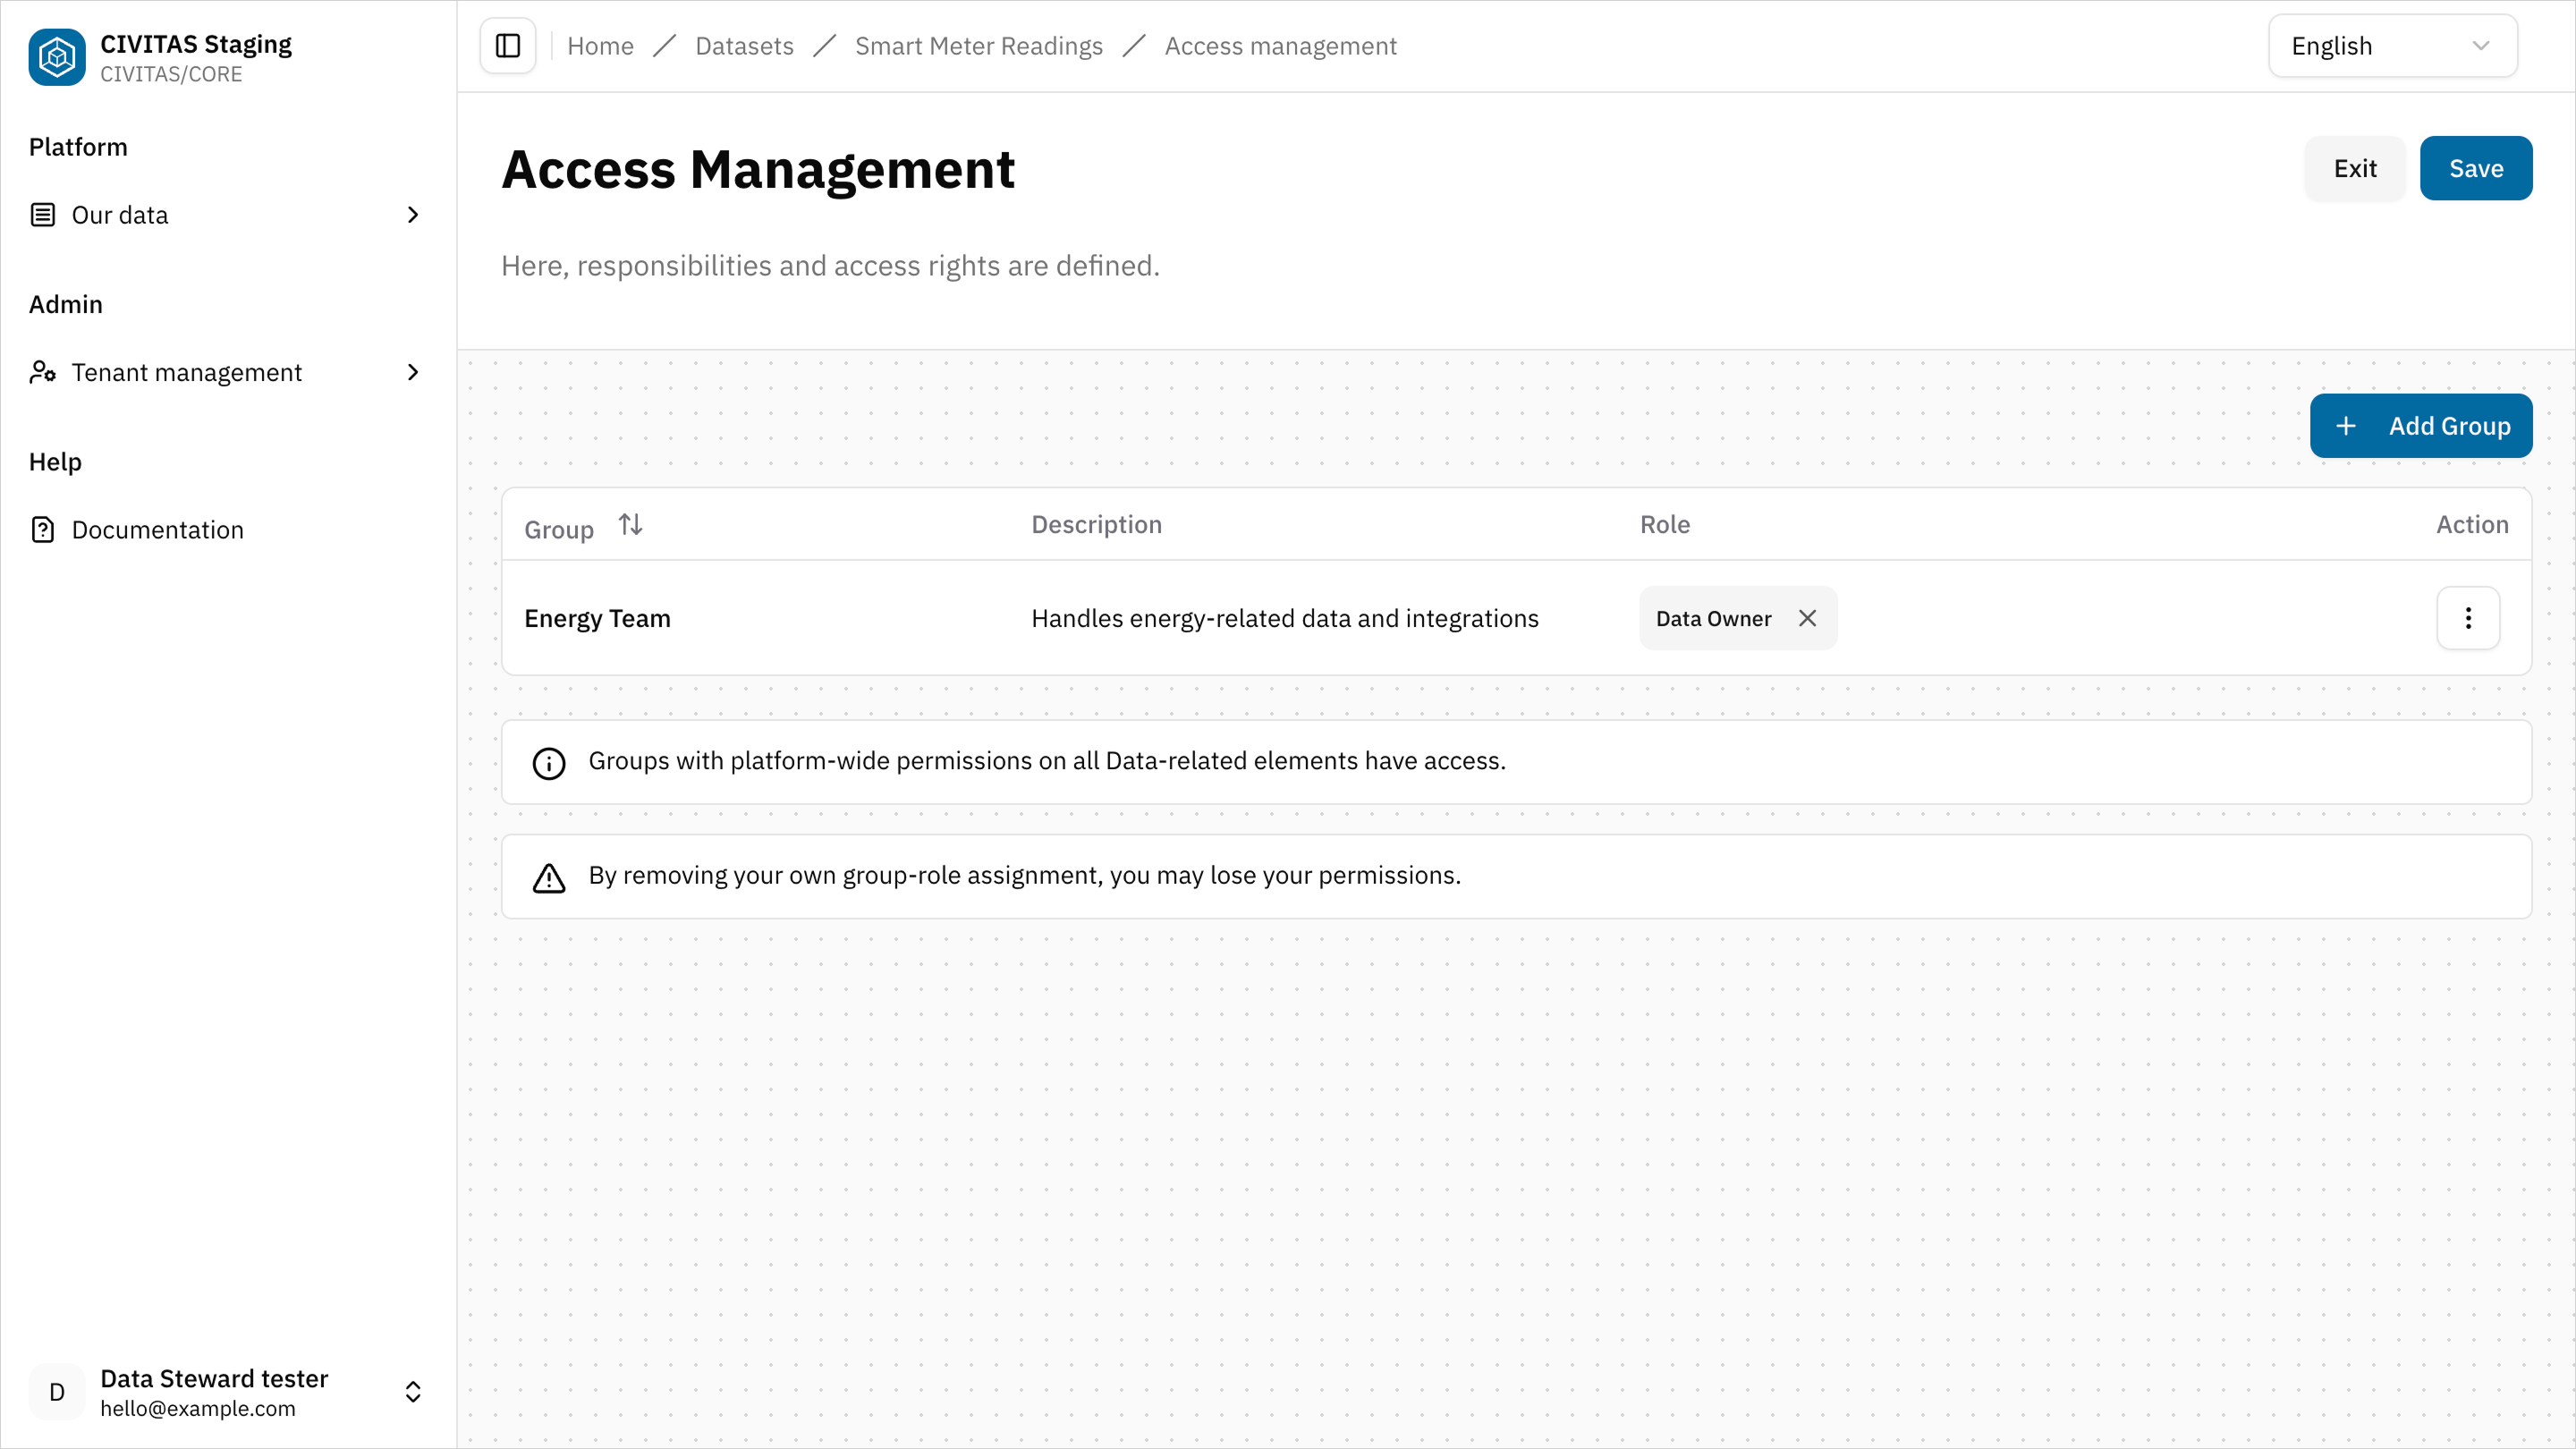
- Assign a Role to the Group
- Repeat these steps to add more Groups and Roles
- Hit Save and Turn back to the detail view of the Dataset
Step 5: Mark the Dataset as ready
→ Setting the status to Ready signals that the creation phase of the Dataset is complete. The Dataset is now prepared for review.
- Change the Status to Ready
- Contact a Data Owner or Data Gatekeeper to review and release it.
You can:
- share a direct link to the Data source
- or provide the name of the Data source
Pipelines start processing data only after the Dataset has been released and its status has been changed to Available.
Outcome
The Dataset is Ready and can now be reviewed and released.
Summary
You have successfully:
- Created a Dataset
- Defined a Pipeline
- Defined an API
- Configured access permissions
- Marked the Dataset as Ready
Next
You have completed the creation phase of your Dataset. In the next guide, you will:
- review a Dataset
- release it for use
- make it available to others
→ Continue with Release data