Work with geospatial Data
Role: Data Architect, Data Steward
Goal: You want to define, process, publish, and visualize geospatial data using the geospatial capabilities of CIVITAS/CORE.
Before you start
CIVITAS/CORE provides dedicated features for working with geospatial data across different areas of the Platform. This guide introduces the currently available geospatial capabilities and explains where to find them.
Geospatial support is continuously evolving. The features described in this guide represent the current functionality of the Platform. Additional capabilities and deeper integrations will be added in future releases.
Define geospatial data
Define geometry attributes
Navigate to: Data structures → Structure definition
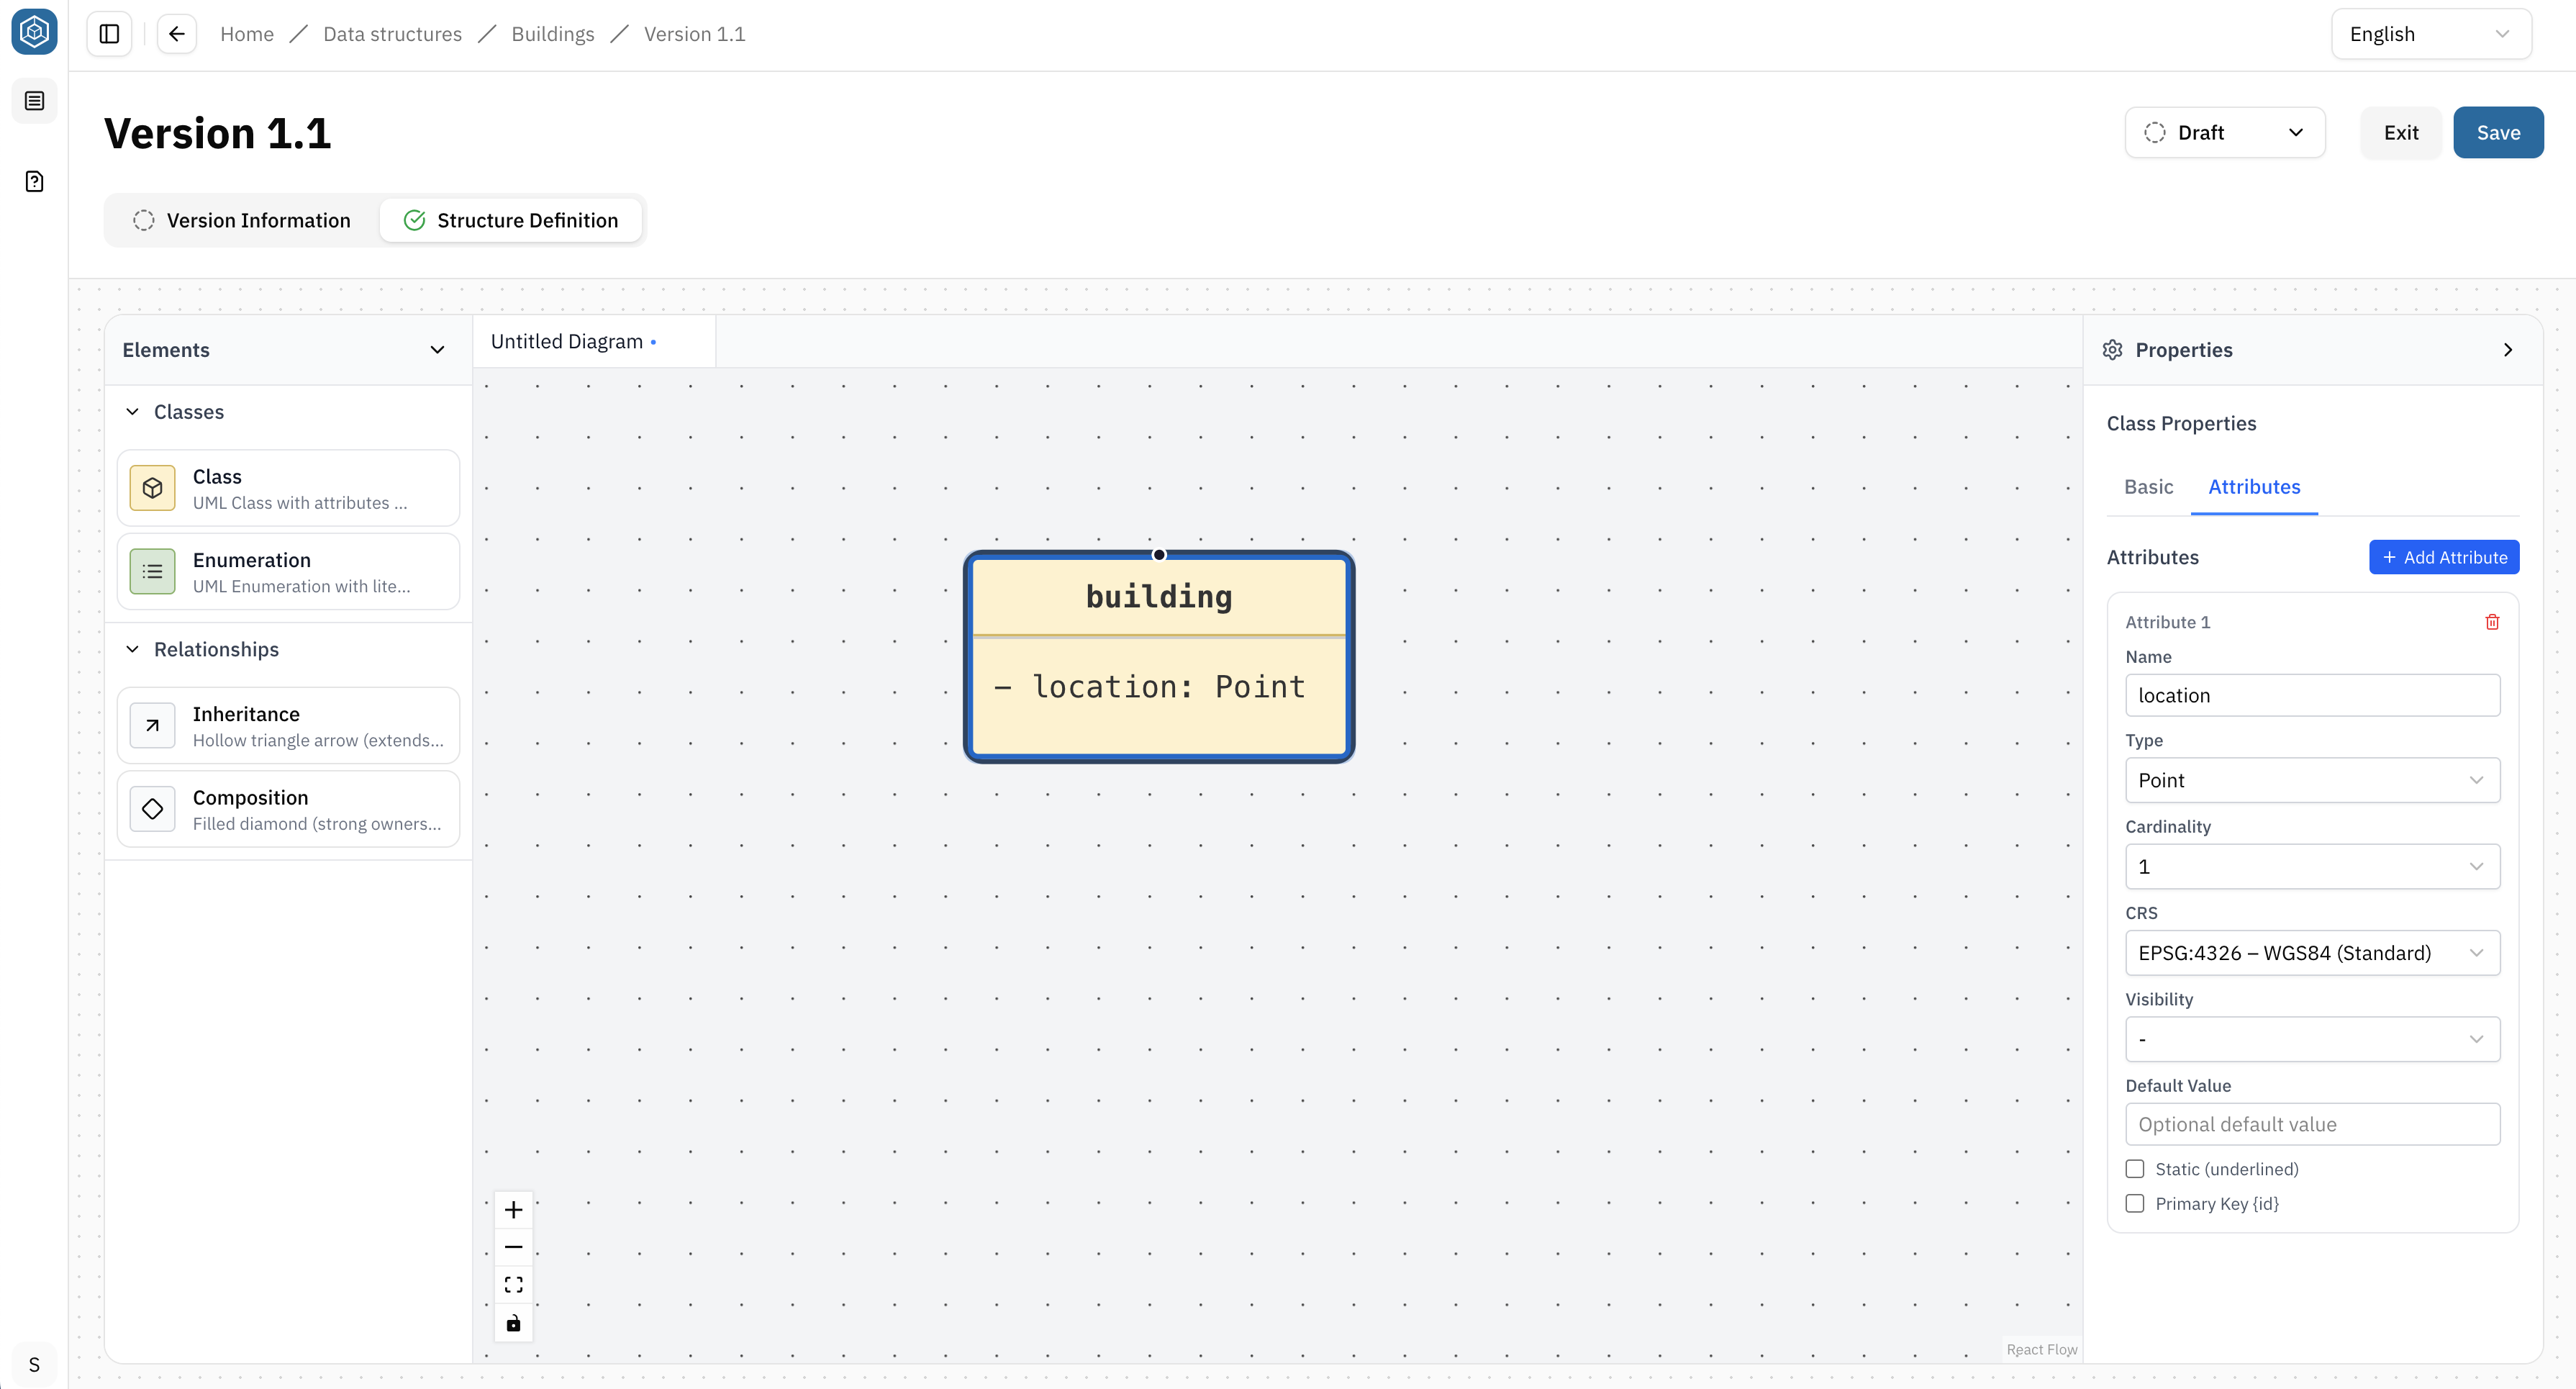
Use the Data Structure canvas to add geometry attributes to your Data structures.
You can:
- create one or more geometry attributes (e.g. points, lines, polygons and others)
- define the Coordinate Reference System (CRS) for the Data structure
A single CRS is defined per Data structure and applies to all geometry attributes contained in that structure.
Create Classes, add Attributes, connect Classes, and configure Relationships in the Data Structure canvas. → Design Data structures
Store geospatial data
Configure Geospatial Data Storage
Navigate to: Datasets → Dataflow → Pipeline
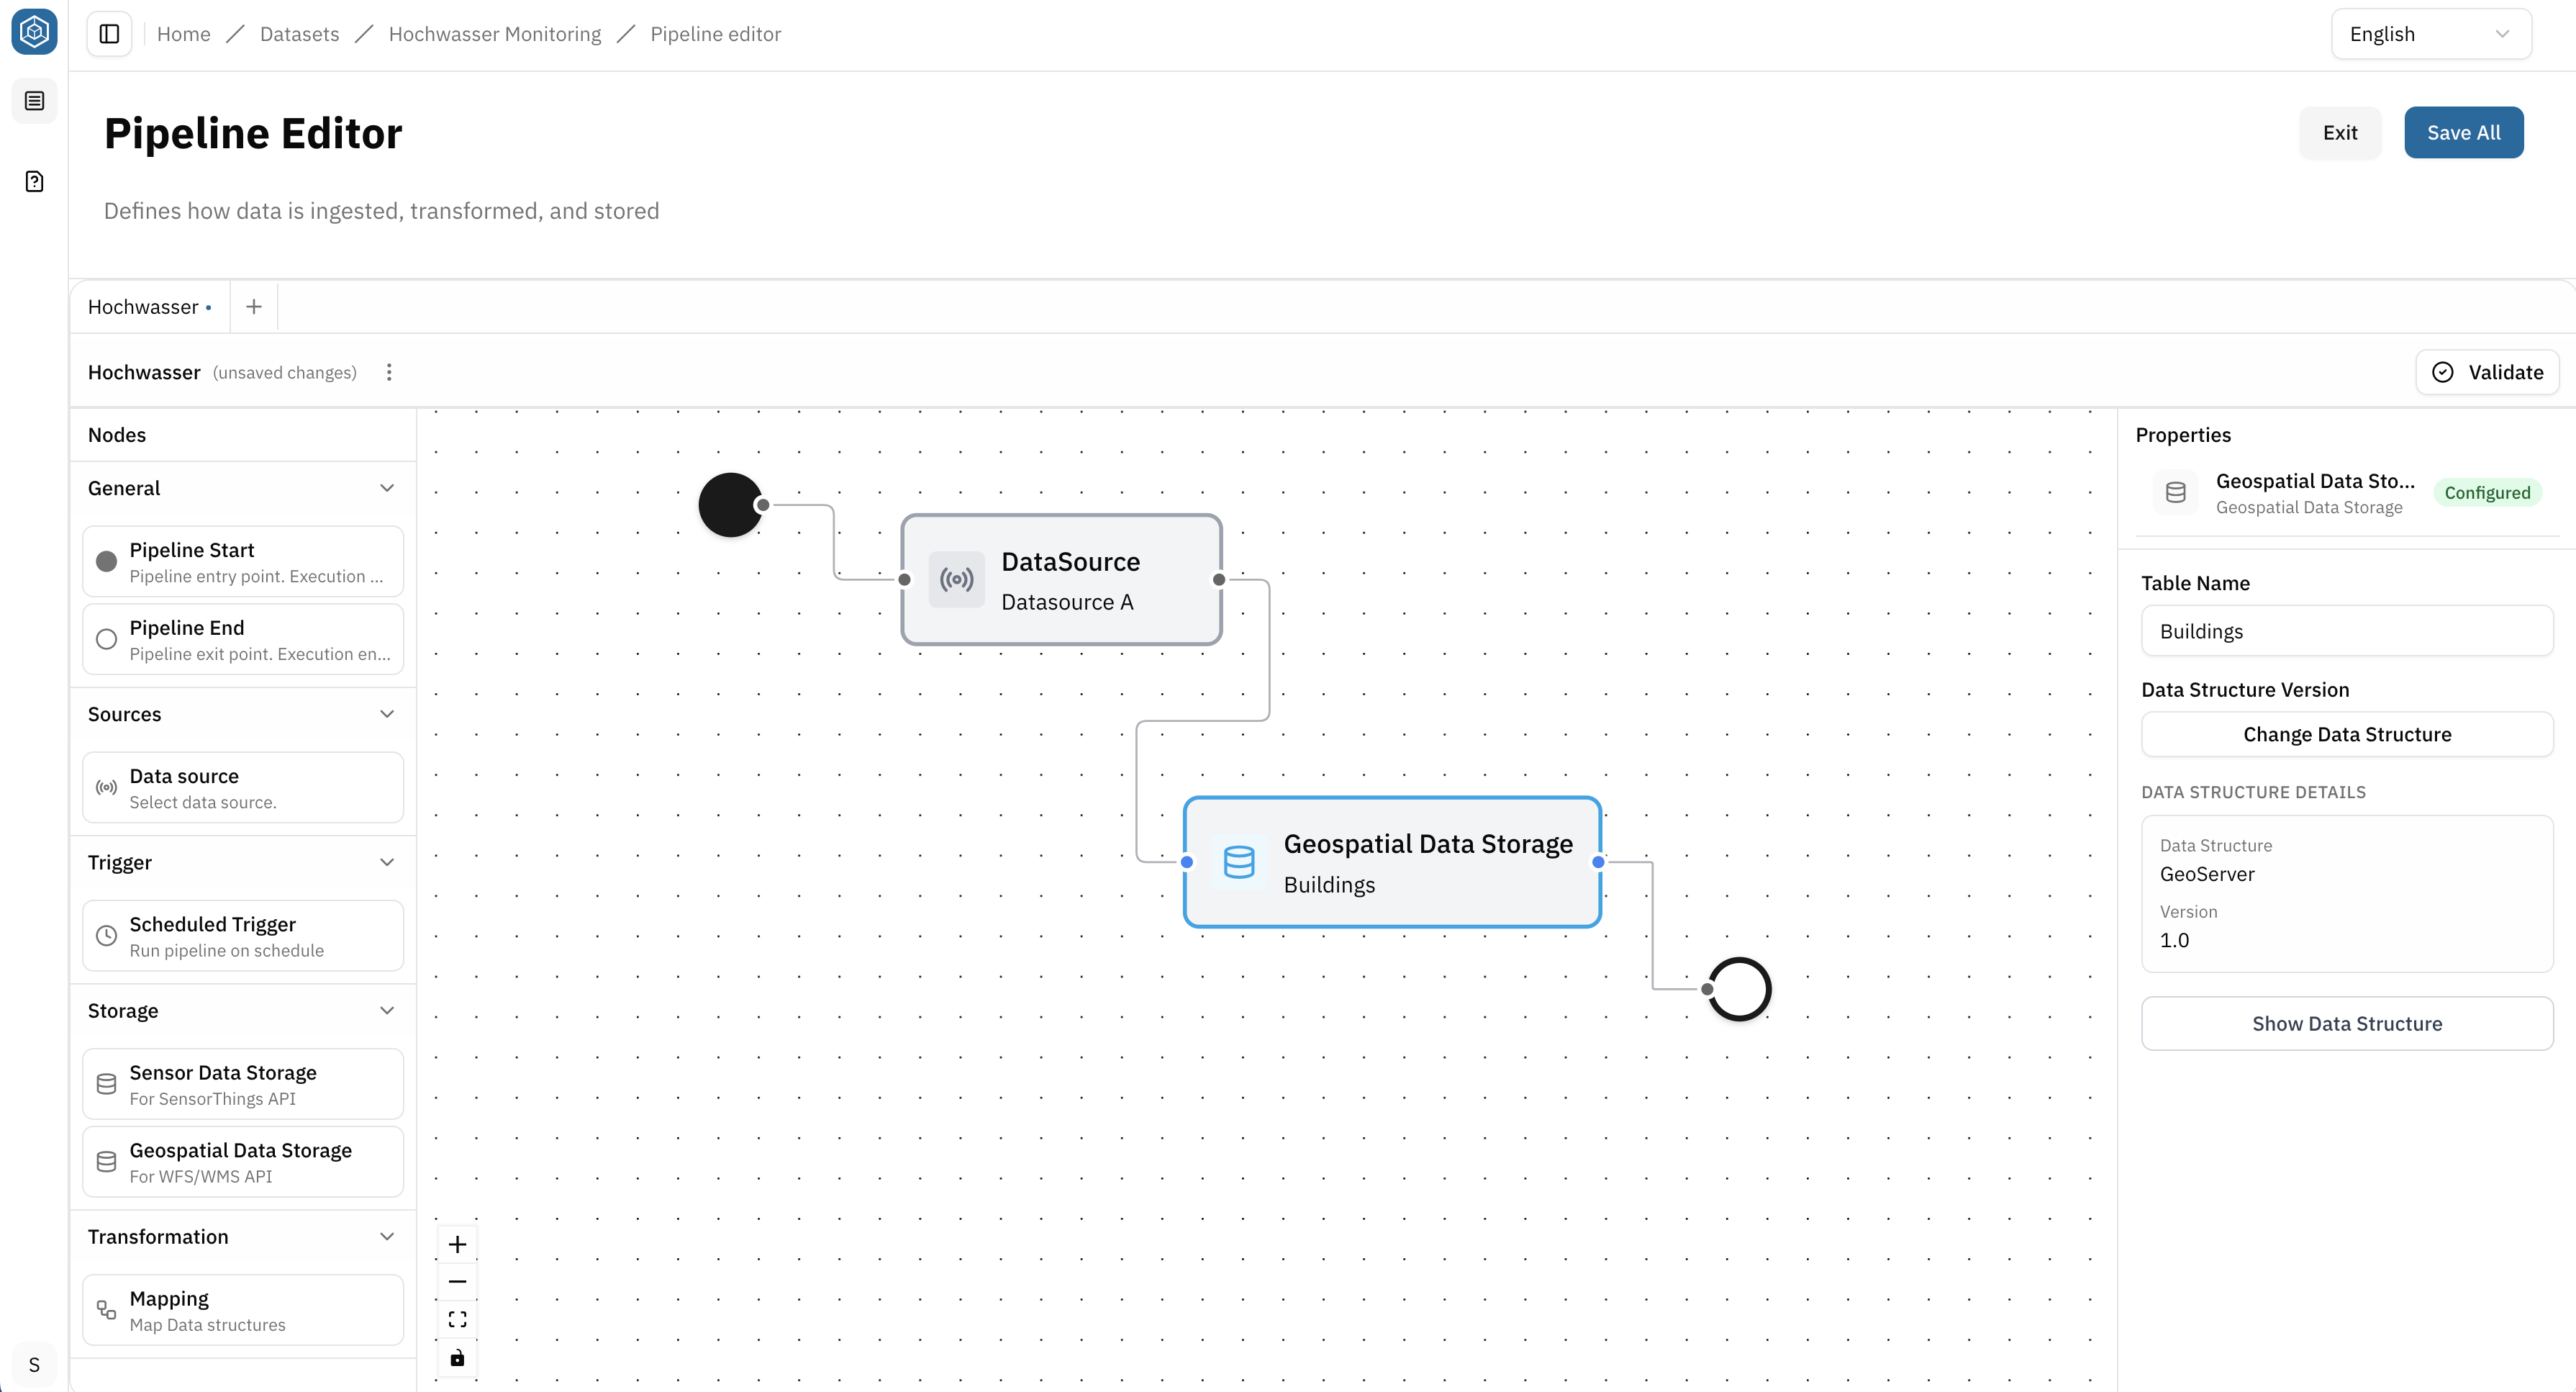
Use the Geospatial Data Storage node to store geospatial data. For each storage node, assign a Data structure that defines the table schema.
You can:
- create one table per Geospatial Data Storage node
- add multiple storage nodes to create multiple tables
- define a table name for each storage node
- assign a Data structure to each storage node
Each storage node creates one target table for stored geospatial data. The structure of the table is defined by the assigned Data structure.
Create and connect nodes, configure Data sources and Storage nodes, and define how data flows through a Pipeline. → Build Pipelines
Transform geospatial data
Configure mappings
Navigate to: Datasets → Dataflow → Pipeline → Mapping Node
Mappings transform incoming data into the structure required by the Geospatial Data Storage.
Typical examples include mapping latitude and longitude to a geometry attribute
Assign input and output Data structures, connect Attributes, and apply transformations where required. → Create Mappings
Publish geospatial data
Create a WFS/WMS API
Navigate to: Dataset → Dataflow → APIs
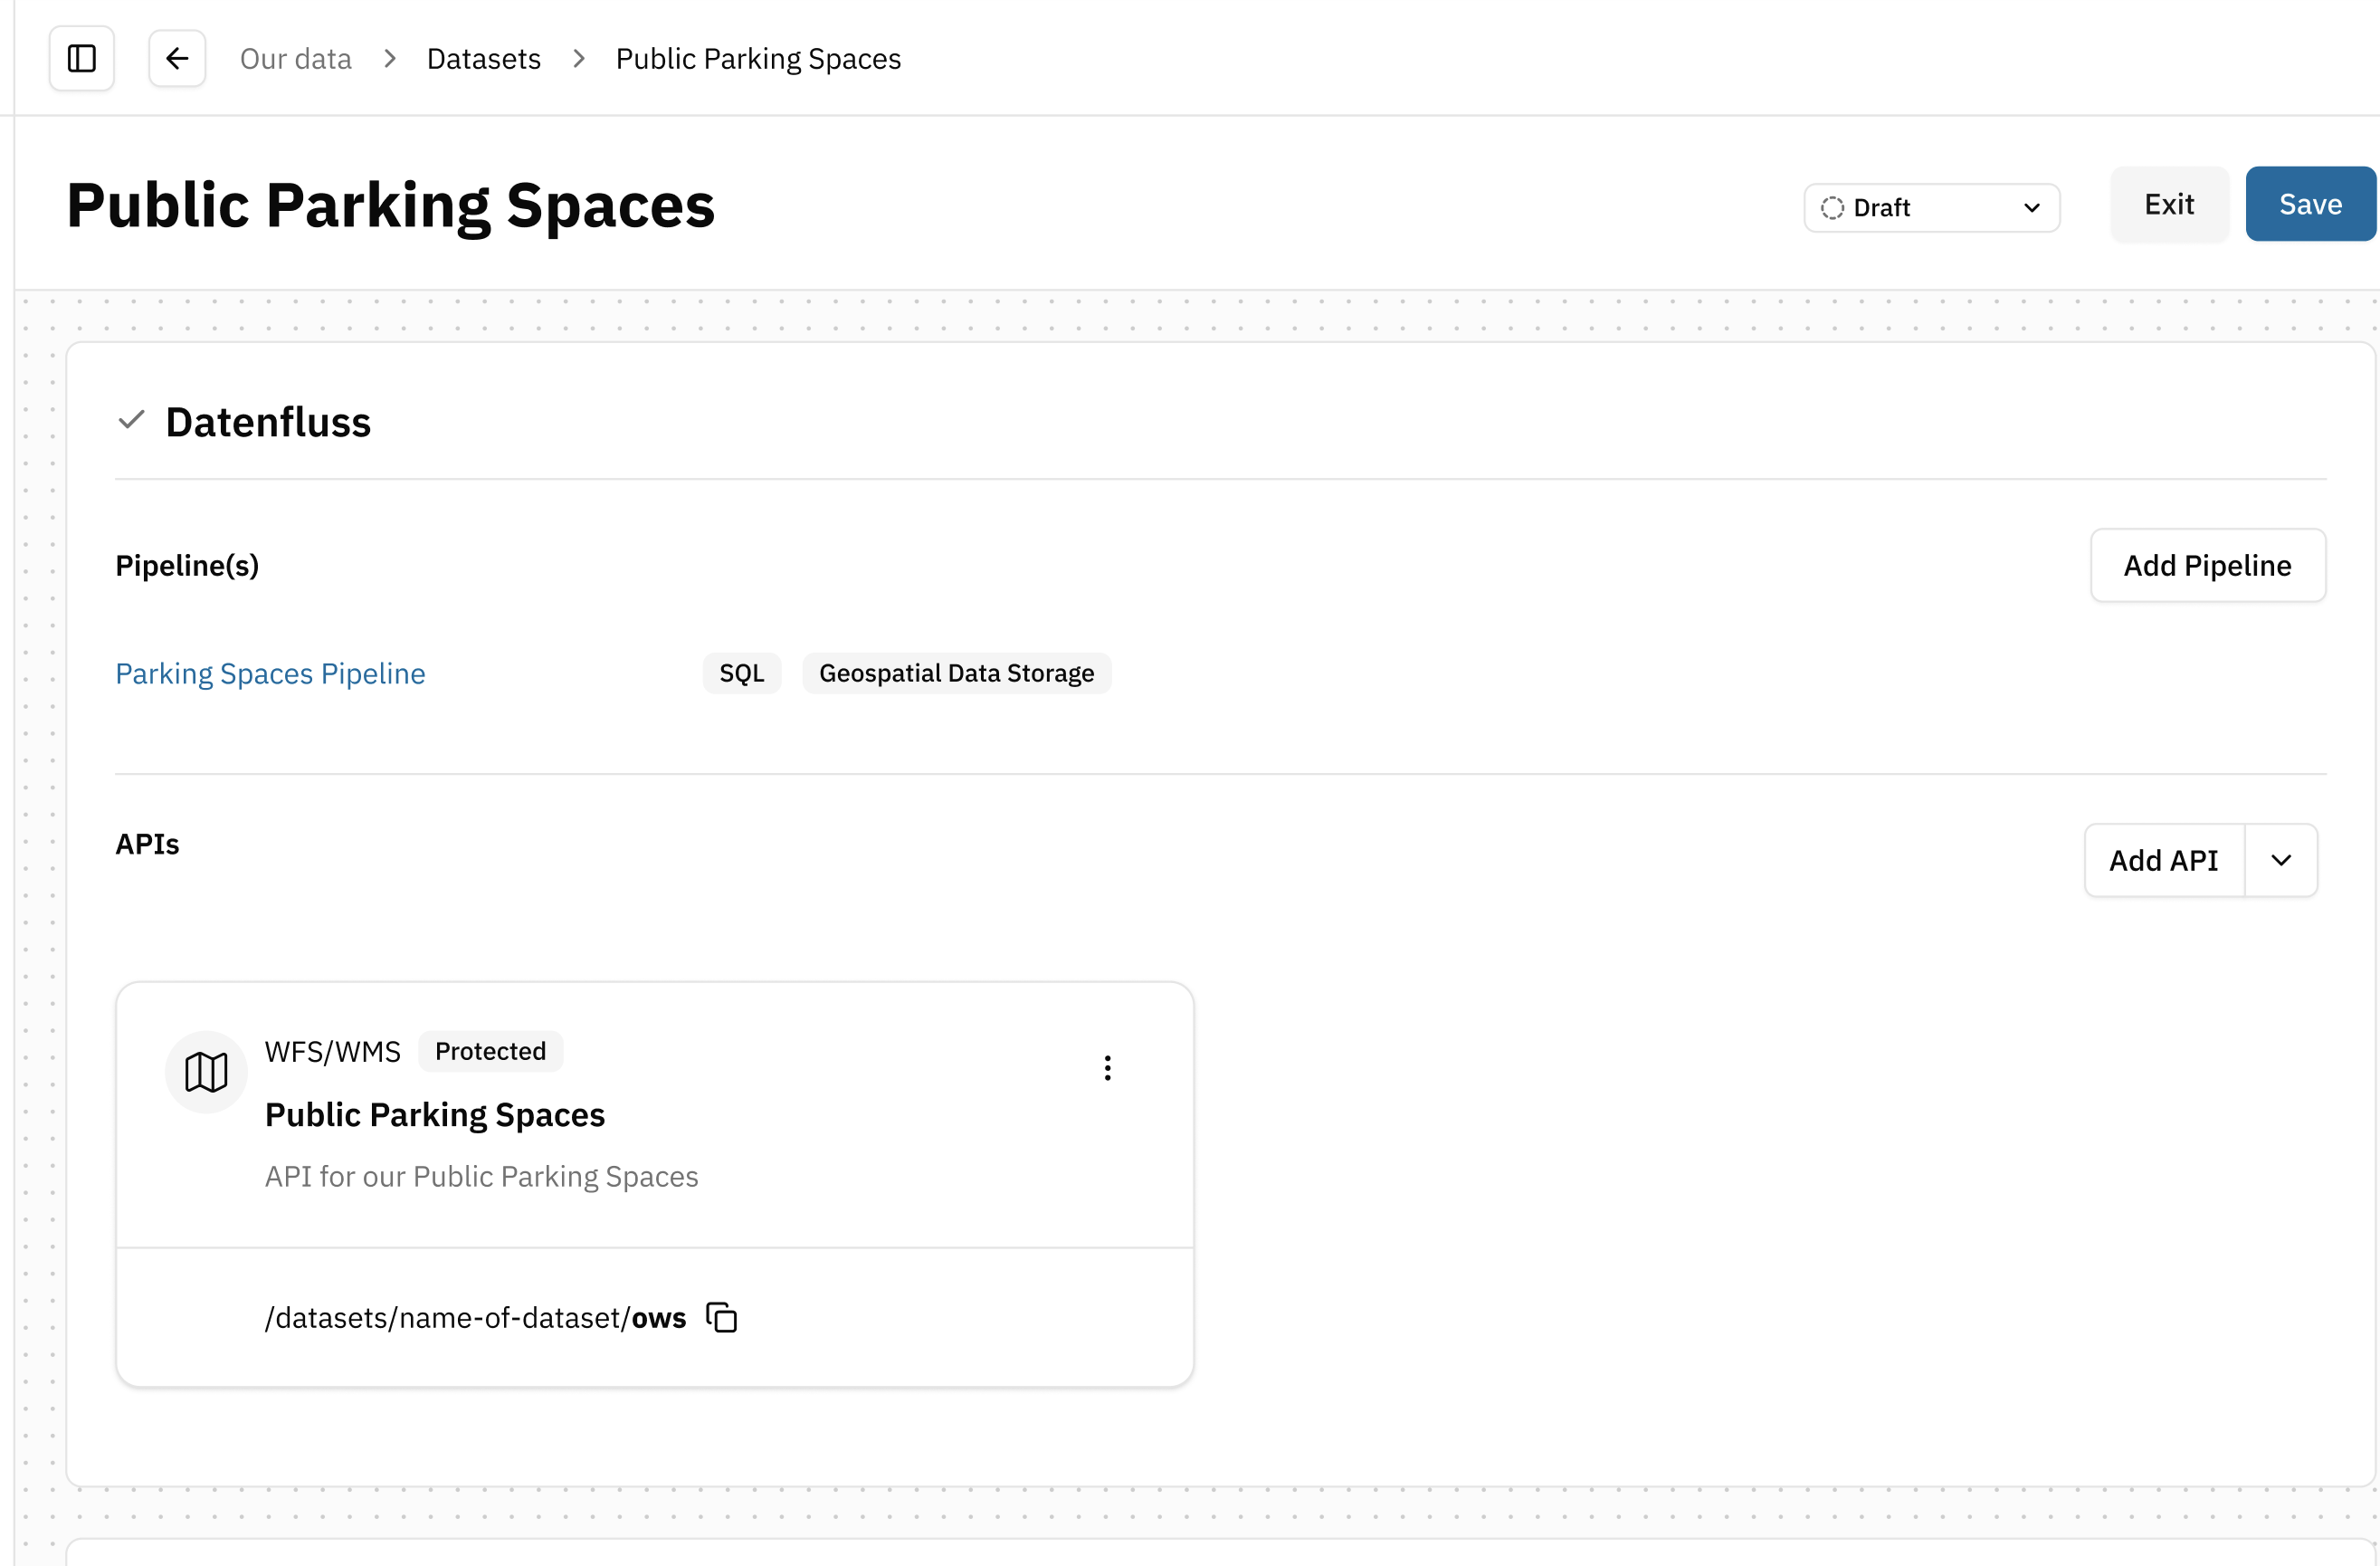
A Dataset can expose geospatial data through a WFS/WMS API. Each Dataset can contain one WFS/WMS API.
Requirements:
- a valid Pipeline
- at least one Geo Data Storage node
Configure Layers
Navigate to: WFS/WMS API → Layers
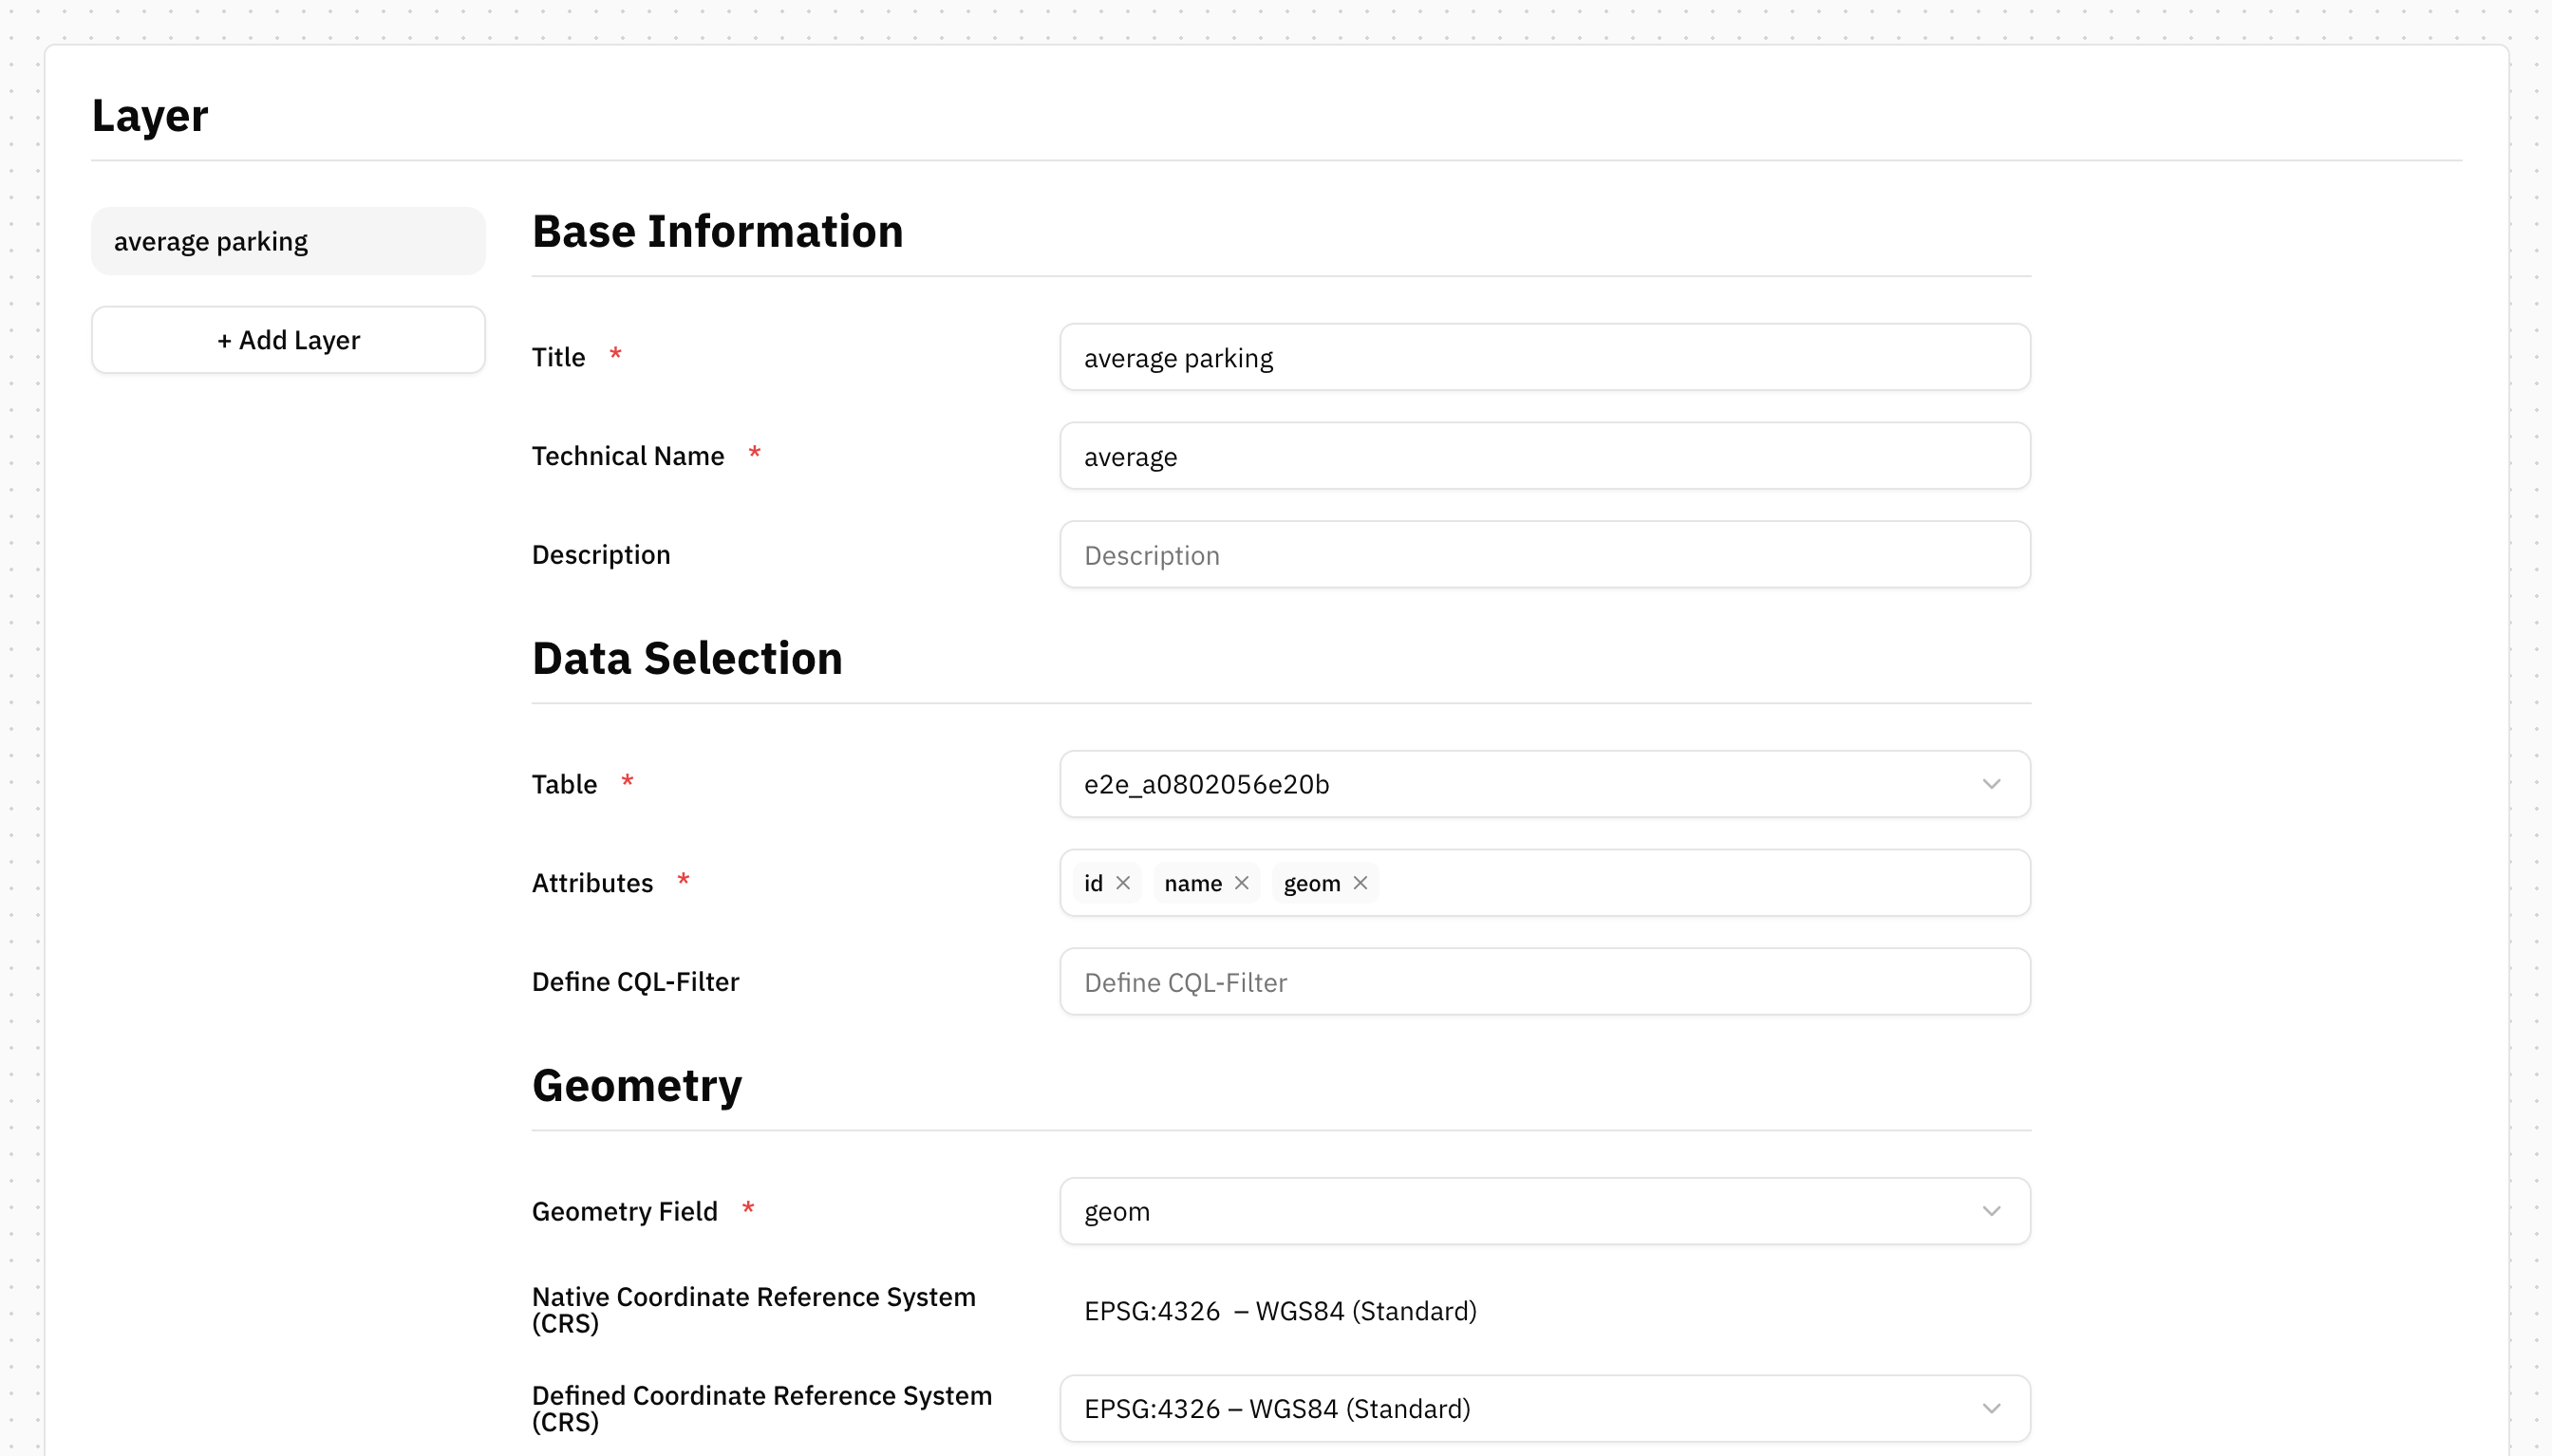
One API can contain multiple Layers. Each Layer defines which part of the stored geospatial data is exposed.
Choose the data to expose
For every Layer you must select:
- the storage table
- the attributes that should be published
→ Attributes are not selected automatically. This is a deliberate security measure to ensure that only explicitly selected attributes are exposed. To simplify configuration, you can either select individual attributes or use Select All.
Filter features using CQL
Layers can expose only a subset of the stored data. Use a CQL (Common Query Language) filter to define which features should be included. Example: parkingType = 'Accessible' This filter exposes only accessible parking spaces.
Configure geometry
Each Layer requires a geometry definition.
Select:
- the geometry attribute
- the preferred CRS
The native CRS defined in the Data structure is displayed as read-only. Optionally, specify another CRS to be used when serving the Layer.
Configure the Bounding Box
The Bounding Box can be:
- entered manually
- generated automatically from the selected CRS
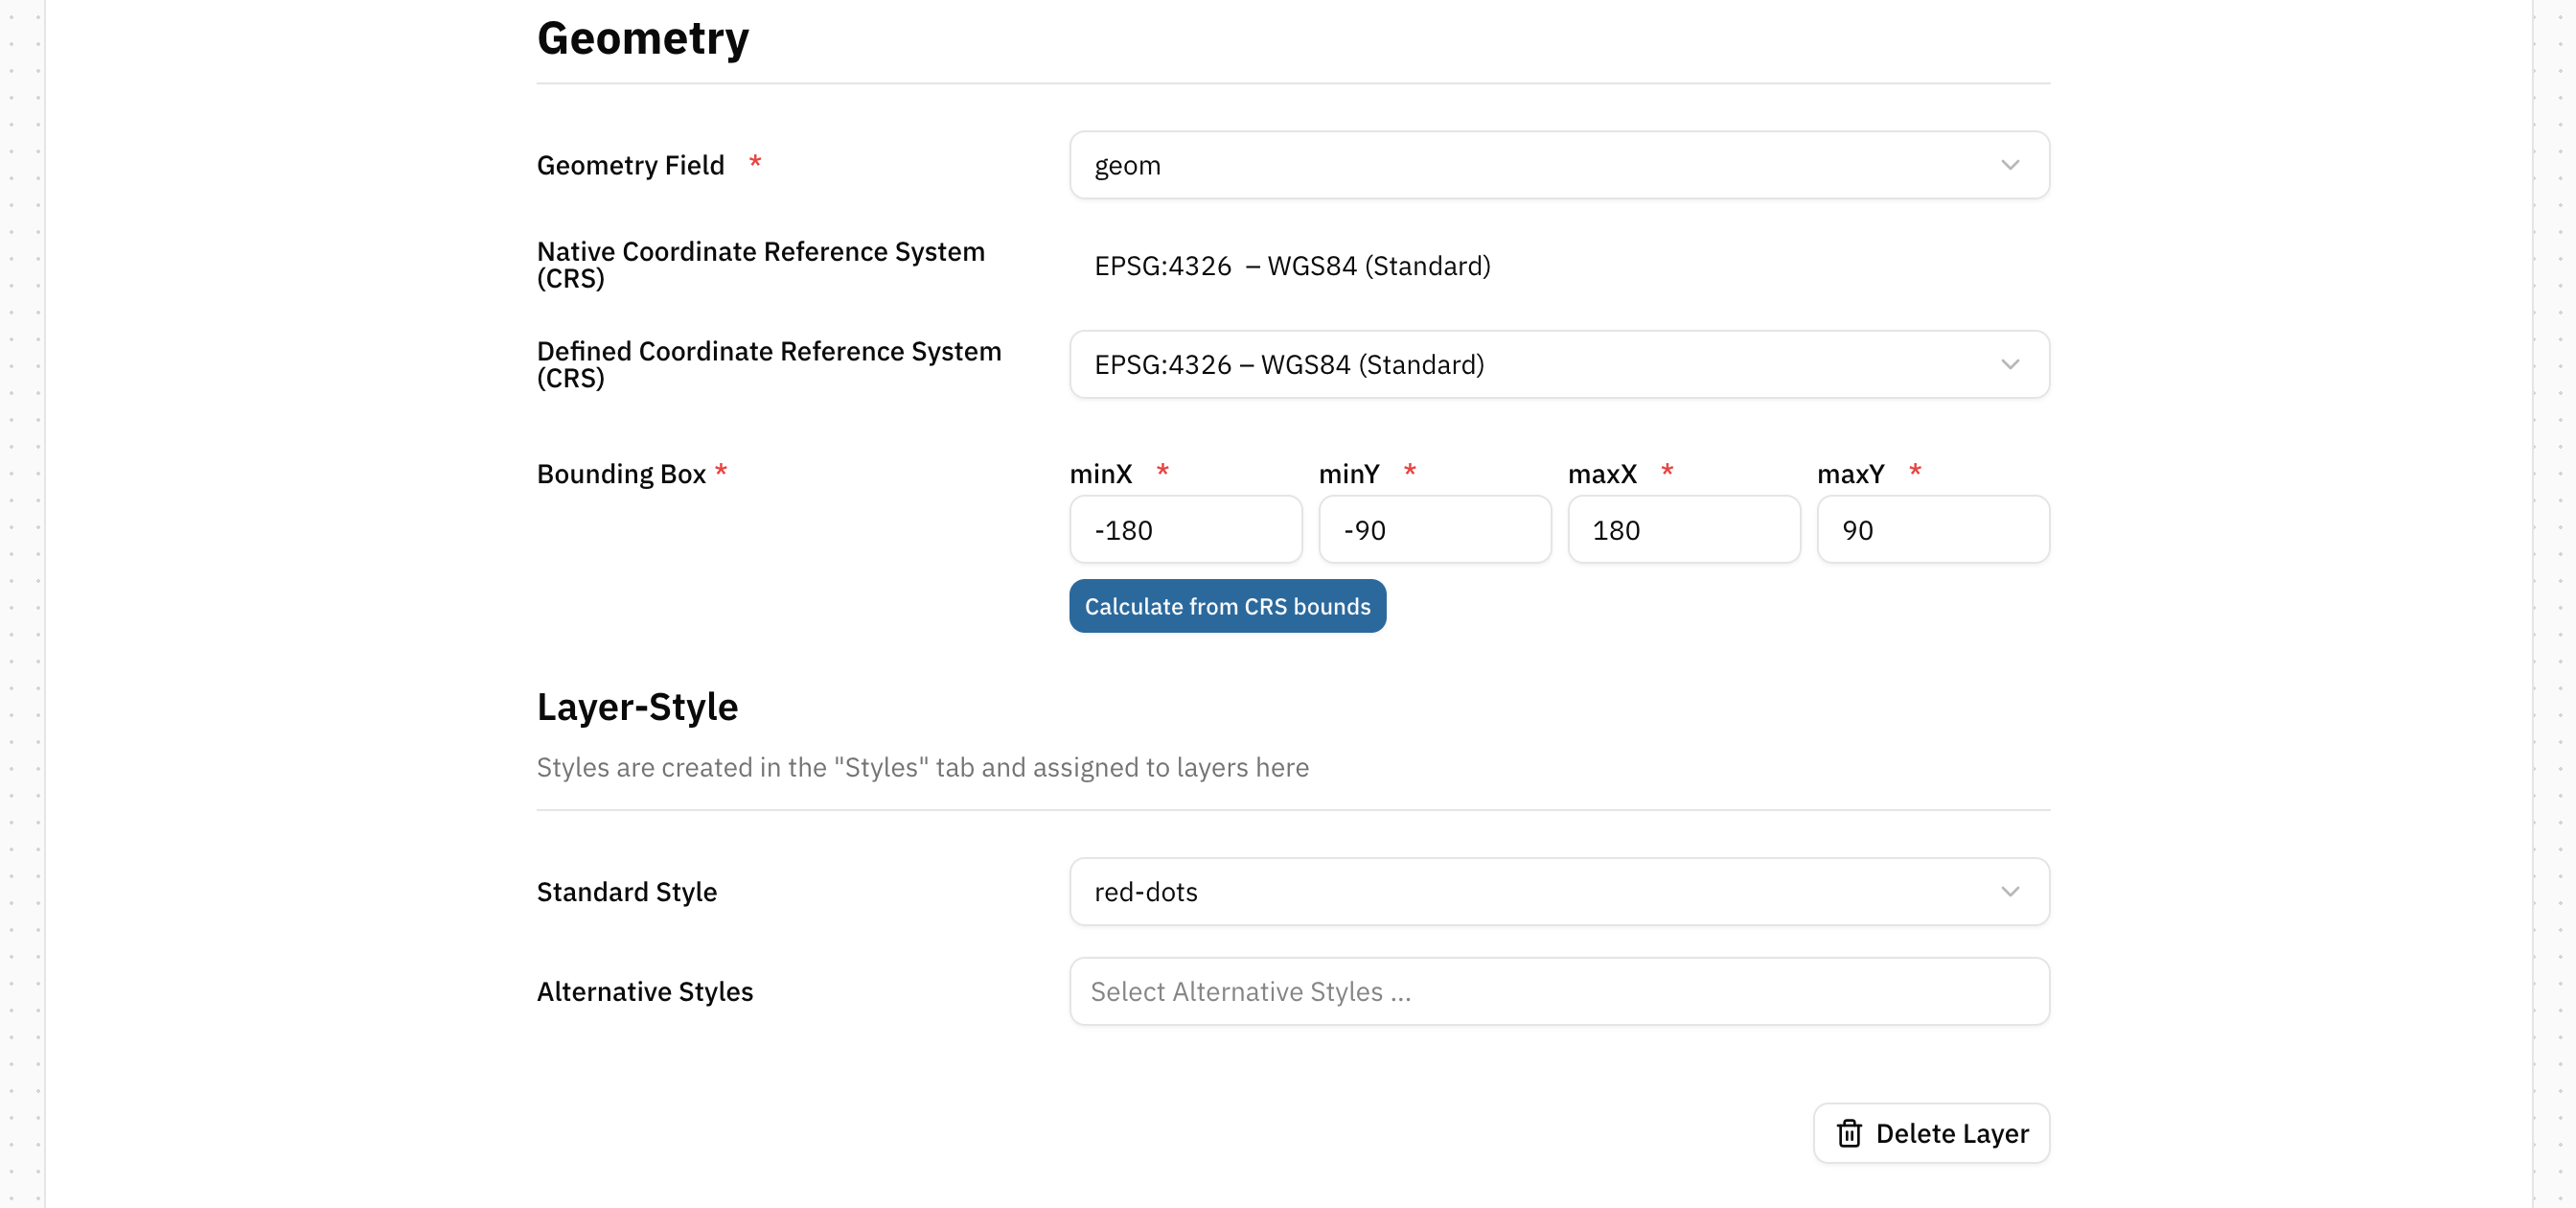
Assign Styles to Layers
Select a Style for the Layer. They are created in the Styles tab and assigned to Layers in the Layers tab.
If no Style is assigned, the Platform uses a default visualization style.
Configure Styles
Navigate to: WFS/WMS API → Styles
Create one or more Styles.
Each Style requires:
- a name
- an SLD file
SLD (Styled Layer Descriptor) is an XML-based standard defined by the OGC (Open Geospatial Consortium) for describing how geospatial data should be rendered. SLD files define colors, symbols, labels, line styles, polygon fills and scale-dependent rendering. They can be created manually or exported from GIS software such as QGIS.
Style Editor
Uploaded SLD files are displayed in the Style Editor. Advanced users can also edit or write SLD directly within the editor.
Visualize geospatial data
Geoportal
Geoportal is available as an optional deployment add-on for displaying geospatial data on interactive maps. Configuration is currently performed outside CIVITAS/CORE.
Learn more → Add-ons: Geoportal
Summary
CIVITAS/CORE supports geospatial workflows throughout the Platform:
- define geometries in Data structures
- store geospatial data using Geo Data Storage
- transform geospatial data using Mappings
- publish geospatial data through WFS/WMS APIs
- configure Layers and Styles
- visualize data using Masterportal